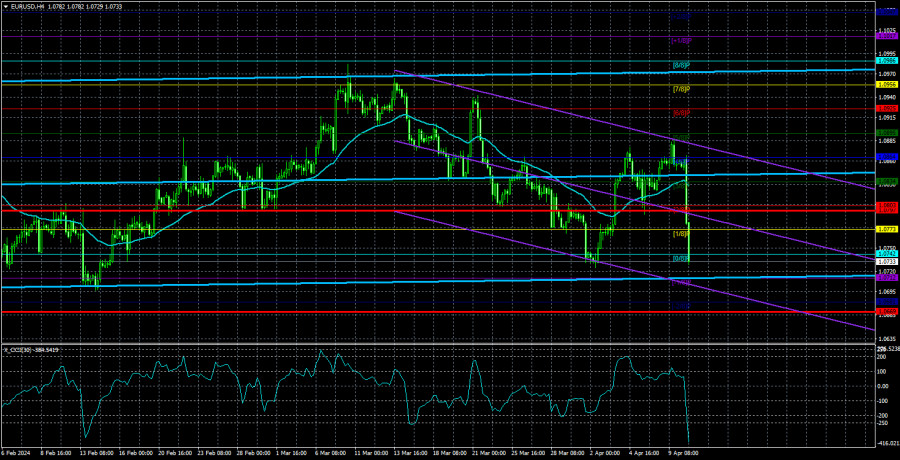
The EUR/USD currency pair traded in familiar channels with minimal volatility during the European trading session on Wednesday. However, during the American session, it plummeted downward. We doubted the market would logically react to the U.S. inflation report, but justice prevailed. American inflation not only increased in March but also exceeded even the most pessimistic forecasts. What does this imply? Only that, the Fed will refrain from lowering rates in April and even abandon monetary policy easing in June. However, we have discussed this many times before.
Market participants who believed in a 5-6 step rate cut from the beginning of the year feel worse and worse with each passing month. They are not completely abandoning their chosen strategy and continue to avoid buying the dollar with all their might. However, eventually, even they are forced to sell the pair since selling the dollar is impossible when inflation in the U.S. is constantly rising.
The EUR/USD pair quickly returned below the moving average line. As before, we only expect the pair to decline. The macroeconomic and fundamental background remain in favor of the U.S. currency alone. Inflation in the U.S. is rising, the economy is strong, and the labor market is stable. What else is needed for the Fed to continue to keep the rate at its maximum value while the ECB begins to lower it?
Considering the overall fundamental background, the European currency should be much lower than current levels. Not only is the ECB's rate 1% lower than the Fed's rate, but now it will also be lowered at a faster pace. Before the publication of the latest inflation report, experts expected 2-3 rate cuts from the Fed in 2024. Now, this number may decrease to 1-2. It turns out that the most "dovish" scenarios did not materialize, and the market held demand for the euro high and for the dollar low absolutely in vain.
So, inflation in the U.S. rose to 3.5% in March, while core inflation remained at 3.8%. One can talk as much as they want about the slowdown in the producer price index or the "favorite indicator of the Fed" - the personal consumption expenditures price index. But does anyone really believe that core and headline inflation will be ignored by the American regulator? And if inflation is rising, then the Fed should rather consider additional tightening of monetary policy because "something clearly didn't go according to plan." Therefore, there is no way for the EUR/USD pair other than downward.
From a technical point of view, the 24-hour timeframe maintains a downward trend that began last year. Therefore, we continue to expect a new strong downward movement. Of course, the market may again do everything possible to avoid buying the dollar (which it actively did last week). Still, we draw conclusions based on fundamentals, macroeconomics, and technical analysis rather than illogical market perceptions. The pair should continue to decline to the $1.02 level.
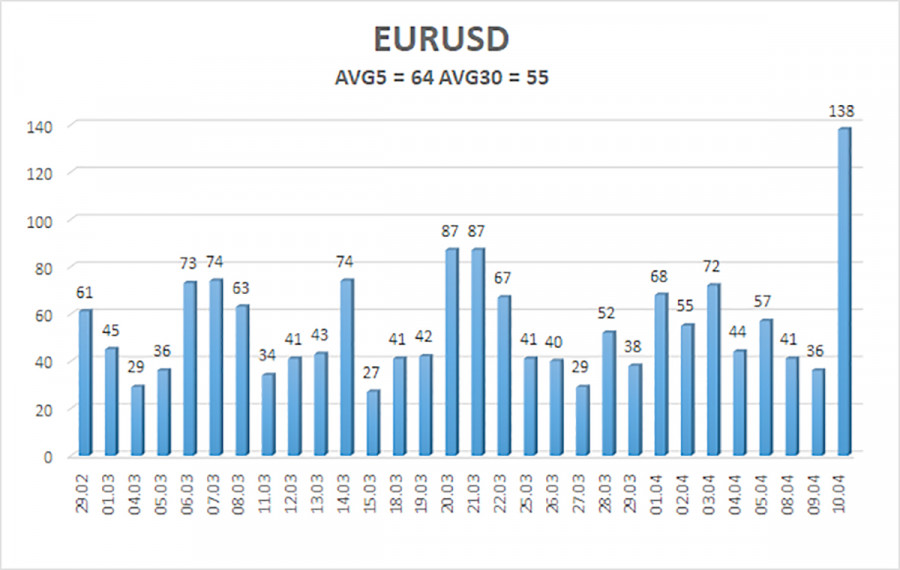
The average volatility of the euro/dollar currency pair over the last 5 trading days as of April 11th is 64 points and is characterized as "average." We expect the pair to move between the levels of 1.0669 and 1.0797 on Thursday. The senior linear regression channel is sideways, but the overall downward trend still persists. The CCI indicator has entered the oversold zone, but we expect only a slight upward retracement.
Nearest support levels:
S1 - 1.0712
S2 - 1.0681
Nearest resistance levels:
R1 - 1.0742
R2 - 1.0773
R3 - 1.0803
Trading recommendations:
The EUR/USD pair sharply turned downward and fell below the moving average. As we assumed, the upward movement turned out to be corrective, and after the correction ended, the downward trend resumed. It resumed sharply and strongly. The European currency should continue to decline almost in any case, so we continue to consider selling with targets at 1.0681 and 1.0669. Buying is considered impractical even if the price consolidates above the moving average line. The fundamental background now is such that only the dollar's rise can be expected.
Illustration notes:
Linear regression channels - help determine the current trend. If both are directed in the same direction, it means the trend is strong.
The moving average line (settings 20.0, smoothed) - determines the short-term trend and direction in which trading should be conducted.
Murray levels - target levels for movements and corrections.
Volatility levels (red lines) - the probable price channel in which the pair will spend the next day, based on current volatility indicators.
CCI indicator - its entry into the oversold zone (below -250) or overbought zone (above +250) indicates that a trend reversal in the opposite direction is approaching.


