empty
01.11.2023 06:45 AM
EUR/USD and GBP/USD: Technical analysis for November 1

EUR/USD

This image is no longer relevant

Higher Timeframes

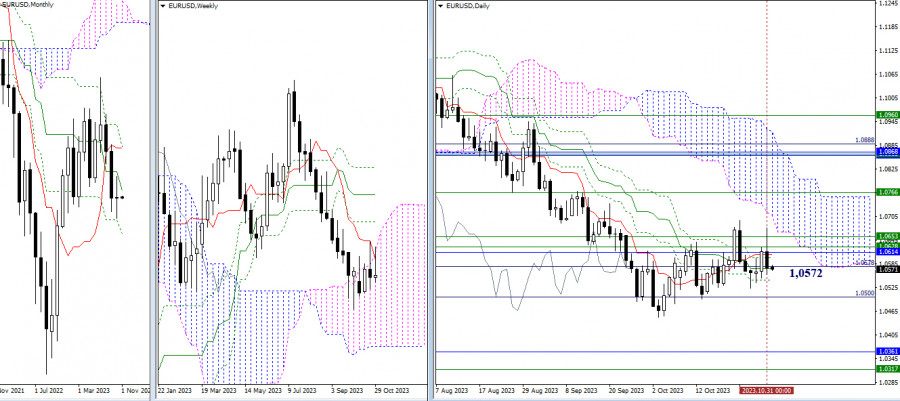
October closed with a candle of uncertainty. The market continues to operate within the range of daily levels, with the center of attraction being the medium-term trend (1.0572). At the start of the new trading month, minor adjustments to the Ichimoku indicator on the monthly timeframe led to the strengthening of the current weekly resistance zone (1.0628 - 1.0653) by the monthly medium-term trend (1.0614). As a result, the immediate objectives for bullish players, at the moment, are breaking through resistance levels (1.0614-28-53), updating the high (1.0695), and entering the daily cloud.

In the current situation, bearish players' prospects are focused on breaking through supports at 1.0500 - 1.0449 (the daily target level + the low) and declining towards the final level of the monthly Ichimoku cross (1.0360) and the lower boundary of the weekly cloud (1.0317).

This image is no longer relevant

H4 – H1

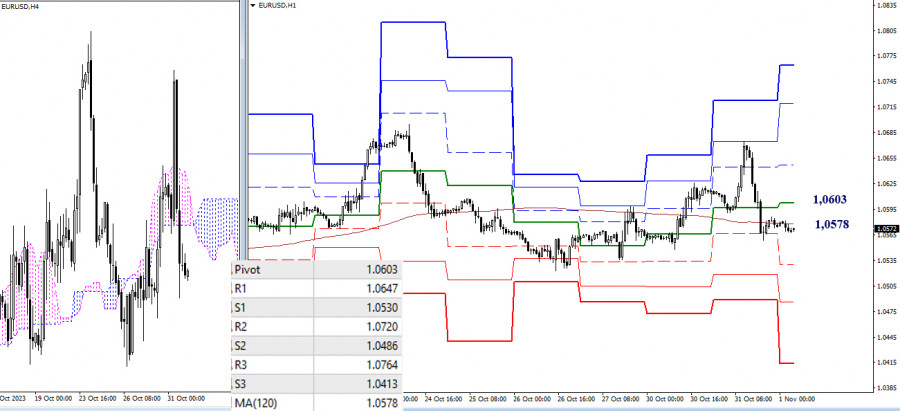
On the lower timeframes, there is also uncertainty in the past few hours. The market is hovering around the attraction zone of the weekly long-term trend (1.0578). The moving average is currently in a nearly horizontal position, confirming the balance of power. In the event of bearish activity and a strengthening of their sentiments, attention will be on passing through the supports of the classic pivot points (1.0530 - 1.0486 - 1.0413). If bulls restore their positions, their interests will shift towards breaking through the resistances of the classic pivot points (1.0603 - 1.0647 - 1.0720 - 1.0764).

***

GBP/USD

This image is no longer relevant

Higher Timeframes

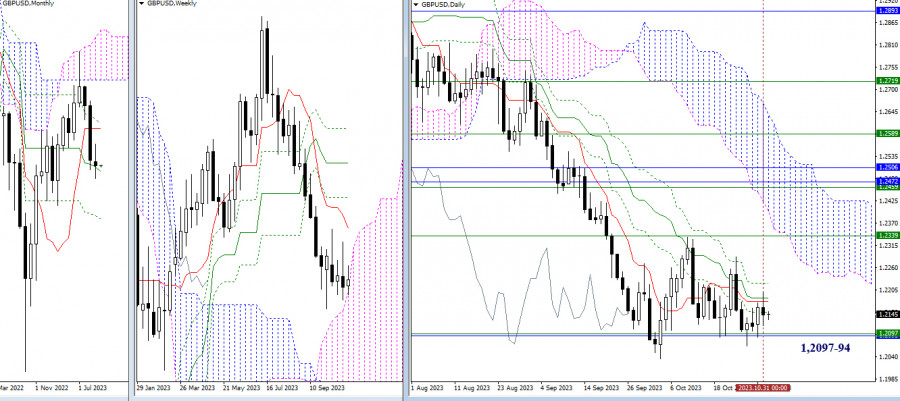
October did not provide clear support to any market players. The pair continues to consolidate around the upper boundary of the weekly cloud (1.2097). Most likely, the pound has decided to enter the weekly cloud in a sideways movement while utilizing the support of the monthly medium-term trend (1.2094). Only directed movement can change the situation. For bullish players, it is still important to overcome the attraction of the daily cross levels (1.2151 - 1.2178 - 1.2186 - 1.2221) and secure the support of the weekly short-term trend (1.2339). For bears, it is necessary to break free from the attraction of levels 1.2094 - 1.2097 and restore the downward trend (1.2036) to continue the decline.

This image is no longer relevant

H4 – H1

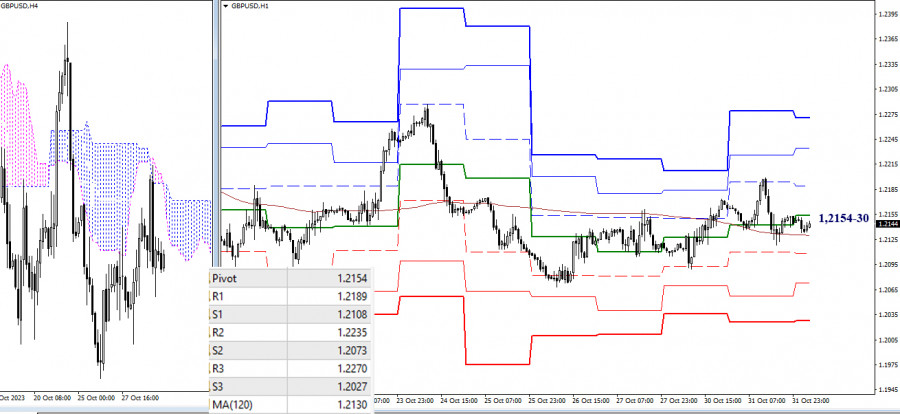
On the lower timeframes, the market is in a state of uncertainty and attraction to key levels, which are currently converging in the 1.2154-30 range (central pivot point + weekly long-term trend). Trading below these key levels will favor the development of bearish sentiments. Intraday bearish targets today are at 1.2108 - 1.2073 - 1.2027 (classic pivot points). Trading above these key levels will contribute to the strengthening of bullish positions. Intraday bullish targets can be noted at 1.2189 - 1.2235 - 1.2270 (resistances of the classic pivot points).

***

The technical analysis of the situation uses:

Higher timeframes - Ichimoku Kinko Hyo (9.26.52) + Fibo Kijun levels

Lower timeframes - H1 - Pivot Points (classic) + Moving Average 120 (weekly long-term trend)

Evangelos Poulakis,
Analytical expert of InstaForex
© 2007-2025
Summary
Urgency
Analytic
Zhizhko Nadezhda
Start trade
Earn on cryptocurrency rate changes with InstaForex
Download MetaTrader 4 and open your first trade
  • Grand Choice
    Contest by
    InstaForex
    InstaForex always strives to help you
    fulfill your biggest dreams.
    JOIN CONTEST

Recommended Stories

The divergence between the RSI(14) indicator and the USD/CHF price movement indicates a re-entry of sellers. Wednesday, August 6, 2025.

USD/CHF – Wednesday, August 6, 2025. With the appearance of a divergence between the price movement and the RSI(14) indicator, which is also in a bearish neutral position

Arief Makmur 06:44 2025-08-06 UTC+2

The strengthening in the AUD/USD has the potential to take this commodity currency to 0.8137. Wednesday, August 6, 2025.

AUD/USD - August 6, 2025. EMA (50) condition has begun to move above the EMA (200), and the RSI (14) indicator is at the extreme bullish level, supported by confirmation

Arief Makmur 06:44 2025-08-06 UTC+2

EUR/USD Forecast for August 6, 2025

Yesterday's U.S. business sentiment data for July came out mixed: Markit's Services PMI rose from 52.9 to 55.7, and the Composite Index increased from 52.9 to 55.1, while

Laurie Bailey 06:01 2025-08-06 UTC+2

GBP/USD Forecast for August 6, 2025

The British pound is consolidating within the 1.3253–1.3364 range in anticipation of tomorrow's interest rate cut by the Bank of England. Has this rate cut already been priced

Laurie Bailey 06:01 2025-08-06 UTC+2

USD/JPY Forecast for August 6, 2025

While the Bank of Japan has loosened its grip, market participants are attempting to follow broader market trends in the USD/JPY pair. They came close to testing the nearest line

Laurie Bailey 05:55 2025-08-06 UTC+2

AUD/JPY. Analysis and Forecast

The AUD/JPY pair is struggling to attract buying interest, trading near the psychological level of 95.00 and close to the nearly four-week low reached the previous day. Moreover, the technical

Irina Yanina 11:38 2025-08-05 UTC+2

Forecast for EUR/USD on August 5, 2025

On Monday, the EUR/USD pair moved sideways above the 100.0% Fibonacci retracement level at 1.1558. Therefore, upward movement may resume at any moment toward the 1.1612 and 1.1645 levels

Samir Klishi 11:32 2025-08-05 UTC+2

Forecast for GBP/USD on August 5, 2025

On the hourly chart, the GBP/USD pair moved sideways above the 127.2% retracement level – 1.3258 – on Monday. As a result, the upward movement may continue on Tuesday toward

Samir Klishi 11:27 2025-08-05 UTC+2

Forex forecast 05/08/2025: EUR/USD, USD/JPY, GBP/USD, Ethereum and Bitcoin

Useful links: My other articles are available in this section InstaForex course for beginners Popular Analytics Open trading account Important: The begginers in forex trading need to be very careful

Sebastian Seliga 11:23 2025-08-05 UTC+2

GBP/USD. Indicator Analysis and Daily Overview for August 5, 2025

On Monday, the pair moved upward, reached the 38.2% retracement level at 1.3338 (red dashed line), then declined and closed the daily candle at 1.3280. Today, it may attempt

Stefan Doll 10:37 2025-08-05 UTC+2
Can't speak right now?
Ask your question in the chat.
Widget callback
 

Dear visitor,

Your IP address shows that you are currently located in the USA. If you are a resident of the United States, you are prohibited from using the services of InstaFintech Group including online trading, online transfers, deposit/withdrawal of funds, etc.

If you think you are seeing this message by mistake and your location is not the US, kindly proceed to the website. Otherwise, you must leave the website in order to comply with government restrictions.

Why does your IP address show your location as the USA?

  • - you are using a VPN provided by a hosting company based in the United States;
  • - your IP does not have proper WHOIS records;
  • - an error occurred in the WHOIS geolocation database.

Please confirm whether you are a US resident or not by clicking the relevant button below. If you choose the wrong option, being a US resident, you will not be able to open an account with InstaForex anyway.

We are sorry for any inconvenience caused by this message.