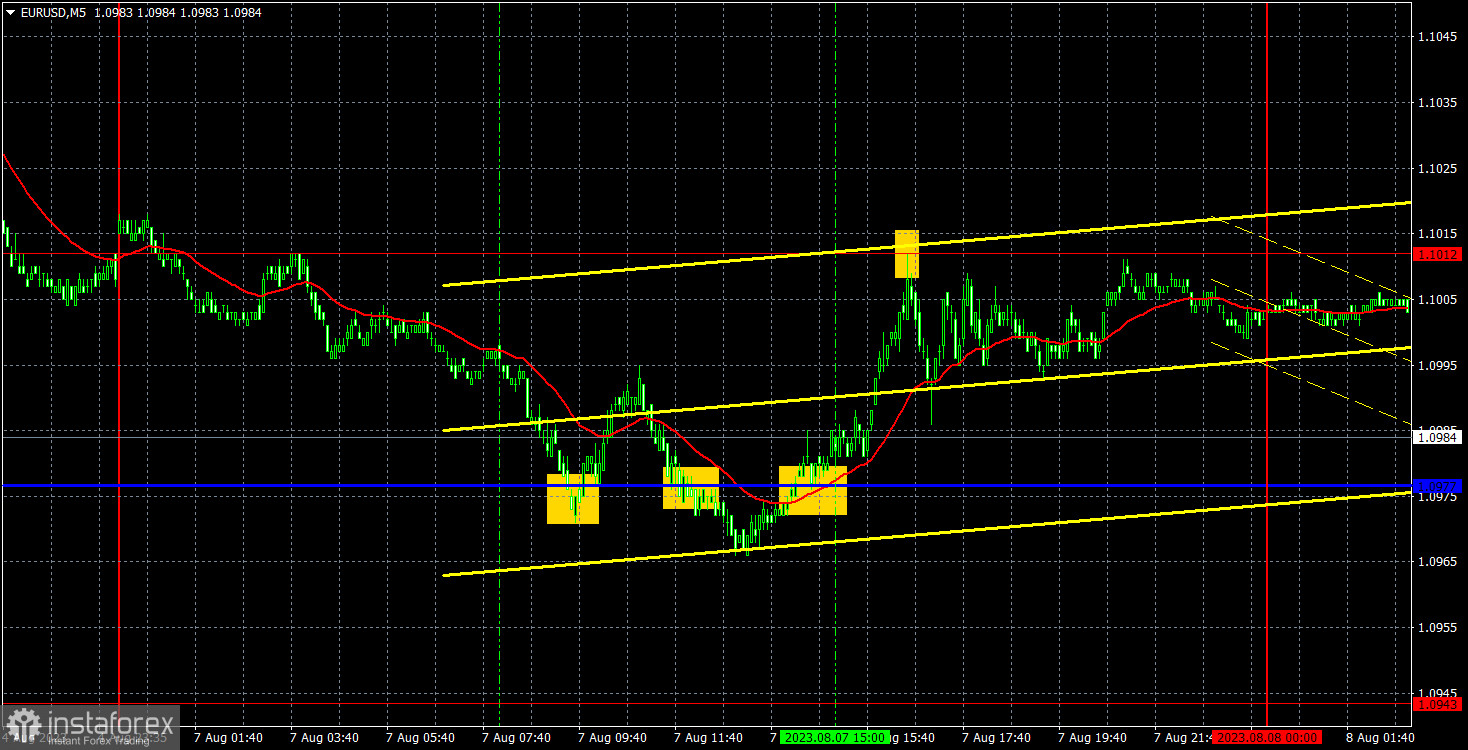
Analysis of EUR/USD 5M
On Monday, the EUR/USD pair went through low volatility and traded mostly sideways. Initially, the pair corrected lower against Friday's rise and then it tried to resume its upward movement. The pair traded alongside no significant economic data so there was nothing that could influence traders' sentiment. Federal Reserve officials spoke, but opinions within the organization have already diverged. Some officials support another rate hike, while others do not. However, this seems to have no impact on the pair's movement. We believe that the corrective phase may continue this week, but in the medium-term perspective, the euro and pound should continue to fall. The main item on this week's agenda is the US inflation report on Wednesday.
Trading signals on Monday, to put it mildly, were not ideal. The price formed two false signals around the critical Kijun-sen line, which is considered strong. If traders could set a Stop Loss at breakeven in the first case, then they couldn't in the second. The third buy signal, which could have resulted in profit, should not have been executed, as the first two turned out to be false. As a result, the day ended with a small loss. By the way, the bounce from the level of 1.1012 could have been traded with a short position, and traders could earn around 20 pips, which would have covered the loss from the first trade.
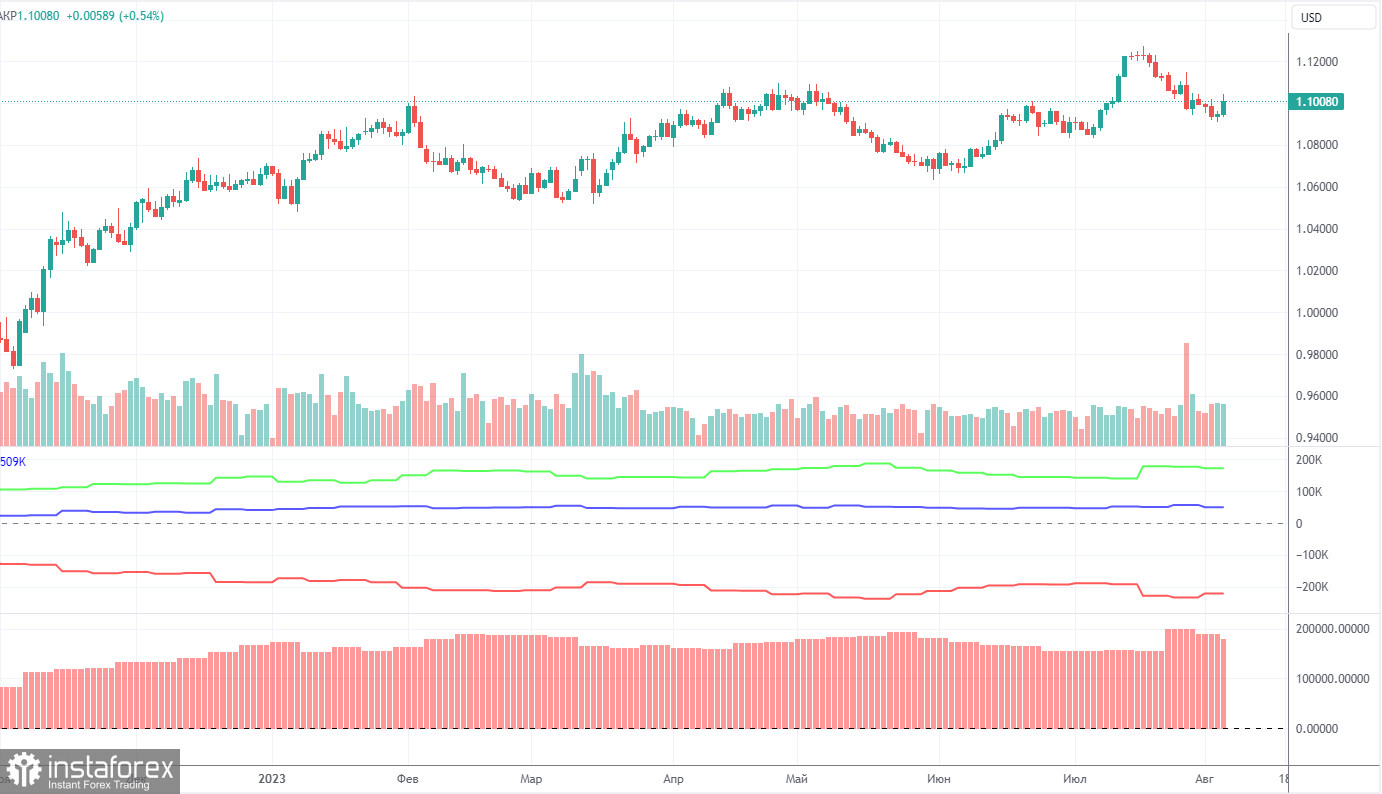
COT report:
On Friday, a new COT report for August 1 was released. In the last 10 months, COT reports fully corresponded to what is happening in the market. The chart above clearly shows that the net position of major traders (the second indicator) began to grow in September 2022 and at about the same time the euro started climbing too. In the last 5-6 months, the net position has not risen but the euro remains at very high levels. At the moment, the net position of non-commercial traders is bullish and remains strong. The euro keeps climbing against the US dollar.
I have already mentioned the fact that a fairly high value of the net position signals the end of an uptrend. This is also confirmed by the first indicator where the red and green lines are very far from each other. Usually, it precedes the end of the trend. During the last reporting week, the number of long positions of the non-commercial group of traders fell by 10,500 and the number of short ones by 5,400. The net position decreased by 5,100 contracts. The number of long positions is higher than the number of short ones of non-commercial traders by 172,000. This is a very large gap as the difference is almost threefold. Even without COT reports, it is obvious that the euro should decline but speculators are still in no hurry to sell.
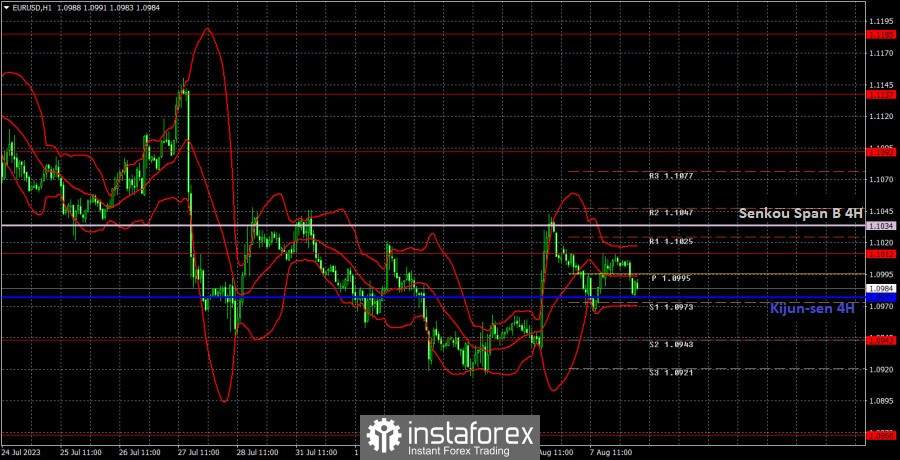
Analysis of EUR/USD 1H
On the 1H chart, the downtrend persists. We believe that the euro should fall in the medium-term period. There are hardly any important reports this week, but the inflation report may be enough to fuel the dollar to grow stronger. However, this report may show that inflation has increased, instead of falling, so the corrective phase may continue.
On August 8, traders should pay attention to the following key levels: 1.0762, 1.0806, 1.0868, 1.0943, 1.1012, 1.1092, 1.1137, 1.1185, 1.1274, as well as the Senkou Span B line (1.1034) and the Kijun-sen line (1.0977). The lines of the Ichimoku indicator can move during the day, which should be taken into account when determining trading signals. There are support and resistance levels that can be used to lock in profits. Traders look for signals at rebounds and breakouts. It is recommended to set the Stop Loss orders at the breakeven level when the price moves in the right direction by 15 pips. This will protect against possible losses if the signal turns out to be false.
Today, there are no important events or reports lined up in the EU and the US. Most likely, we should brace ourselves for another low-volatility day with no trends. The second estimate of German inflation is unlikely to trigger any significant movement, maybe not even by 15 pips.
Description of the chart:
Support and resistance levels are thick red lines near which the trend may end. They do not provide trading signals;
The Kijun-sen and Senkou Span B lines are the lines of the Ichimoku indicator, plotted to the 1H timeframe from the 4H one. They provide trading signals;
Extreme levels are thin red lines from which the price bounced earlier. They provide trading signals;
Yellow lines are trend lines, trend channels, and any other technical patterns;
Indicator 1 on the COT charts is the net position size for each category of traders;
Indicator 2 on the COT charts is the net position size for the Non-commercial group.