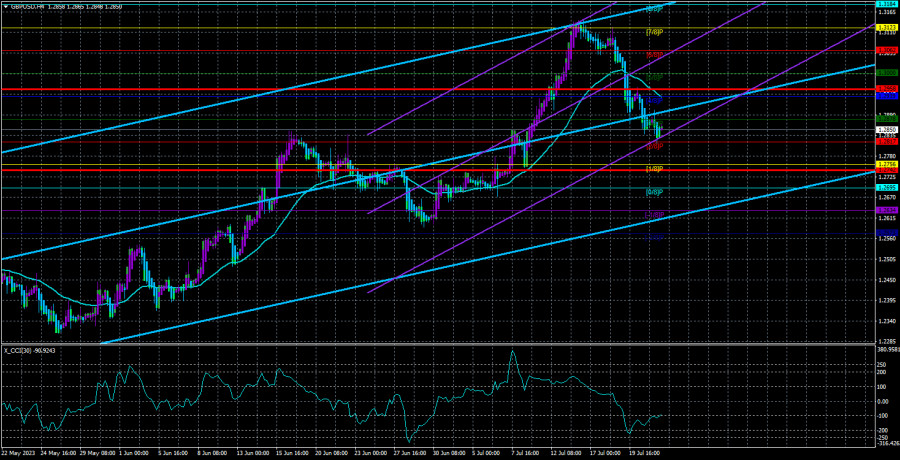
The GBP/USD pair continued its downward movement last Friday, albeit at a slower pace and completely out of sync with the macroeconomic background. However, we have long grown accustomed to the market ignoring macroeconomics and fundamentals or interpreting them as it sees fit. On Friday, there was only one report worthy of attention. Retail sales in the UK in June increased by 0.7%, exceeding the forecast of +0.2% m/m. Thus, a rise in the British pound would have been more logical. However, we ended up seeing a fall, which is more logical from a broader perspective. Namely, the pound has risen by almost 30 cents against the dollar over the past 10 months, with very short corrective movements. Therefore, we believe that the decline should continue.
The new week will begin with reports on business activity in the manufacturing and services sectors. The problems in these sectors are the same as in the European Union and Germany. The manufacturing sectors are clearly struggling. In the UK, business activity in the manufacturing sector has already dropped to 46.5 and may continue to decline in July. In the US, the manufacturing sector is at 46.3 and may also continue to fall in July. The services sectors in both cases are above the 50.0 mark, but they are also decreasing, the reason for which is the monetary policy of both central banks. Thus, the negative trend is likely to continue for the current month, and therefore, neither the dollar nor the pound should have an advantage based on these publications.
However, some reports may cause a market reaction. Notably, in the US, the ISM business activity indices are more important. Therefore, the market is likely to wait for their publication to assess the pace of business activity slowdown.
BoE set to continue its tightening cycle
A few months ago, we assumed that the BoE was preparing to end the rate hiking cycle. Apparently, this was a wrong assumption. The UK economy continues to maintain a balance at 0.0% in quarterly terms, so the UK regulator may keep raising rates for some time. As inflation in the UK is much higher than in the EU or US, the Bank of England needs to extend its tightening cycle compared to its counterparts. Therefore, it appears that the rate will be increased at least two more times. Most likely, the market has already priced in both rate hikes.
The Bank of England does not usually provide traders with many clues regarding its future steps. BoE Governor Andrew Bailey rarely makes loud statements. Therefore, we have to pick information bit by bit to form a full picture. On Friday, one of the members of the Monetary Committee, Dave Ramsden, mentioned that inflation in the country is decreasing but still remains too high. He conceded that a few more rounds of monetary policy tightening may be required to confidently reach the target in the future. Ramsden also supported the idea to accelerate the pace of unwinding the BoE's balance sheet. The Quantitative Tightening (QT) program is the reverse of the Quantitative Easing (QE) program. It involves selling securities from the central bank's balance sheet, which subsequently reduces the money supply in the economy and slows inflation. As we can see, the Bank of England is using all available tools to slow consumer price growth.
On the 4-hour time frame, there is a clear downward trend, which is, however, weaker compared to all previous ascending trend sections. We would not be surprised if the pair resumes the uptrend in the near future. A lot will depend on the rhetoric put forth by Andrew Bailey next week. At the same time, the regulator is nearing the end of its tightening phase. However, if the Federal Reserve starts to lower its rate by the end of the year or gives clear signs of doing so, it could provide an additional bearish factor for the American currency. Indeed, in 2023, the market is primarily looking to sell the US dollar.
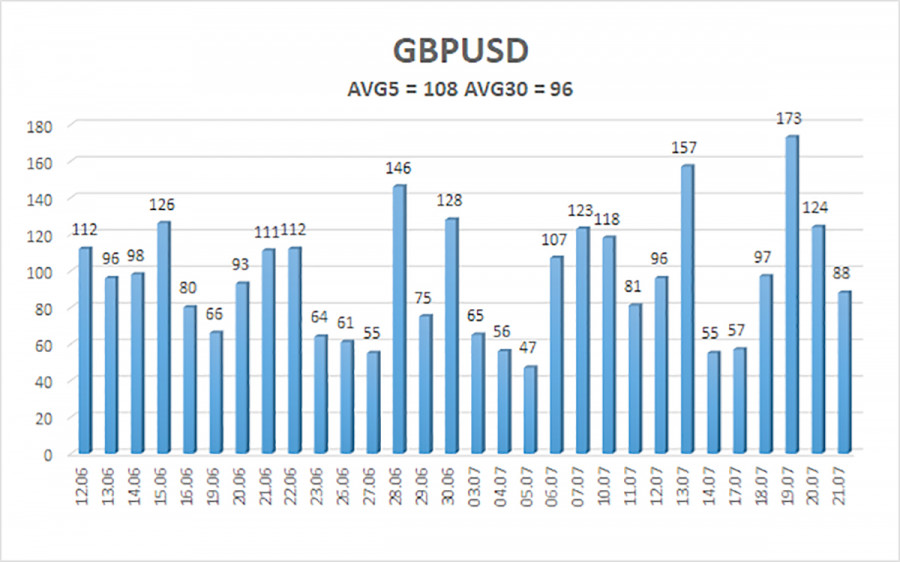
The average volatility of the GBP/USD pair over the last five trading days is 108 pips which is considered average for the instrument. On Monday, July 24, we expect the pair to trade within the range of 1.2742 and 1.2958. A Heiken Ashi indicator turning upward signals a possible upside correction.
Nearest support levels:
S1 – 1.2817
S2 – 1.2756
S3 – 1.2695
Nearest resistance levels:
R1 – 1.2878
R2 – 1.2939
R3 – 1.3000
Trading recommendations:
GBP/USD is holding below the moving average on the 4-hour time frame. At the moment, short positions are relevant with targets at 1.2756 and 1.2742, which should be closed if the Heiken Ashi indicator turns upward. Long positions can be considered when the price settles firmly above the moving average with targets at 1.3000 and 1.3062.
On the chart:
Linear regression channels help to determine the current trend. If both of them are pointed in the same direction, it means that the trend is currently strong.
The Moving Average (period - 20.0, smoothed) shows a short-term trend and the direction in which the pair should be traded.
Murray levels are target levels for price movements and corrections.
Volatility levels (red lines) represent the probable price channel within which the pair will spend the next day, based on current volatility indicators.
The CCI indicator entering the oversold (below -250) or the overbought (above +250) area indicates that a trend reversal is approaching.


