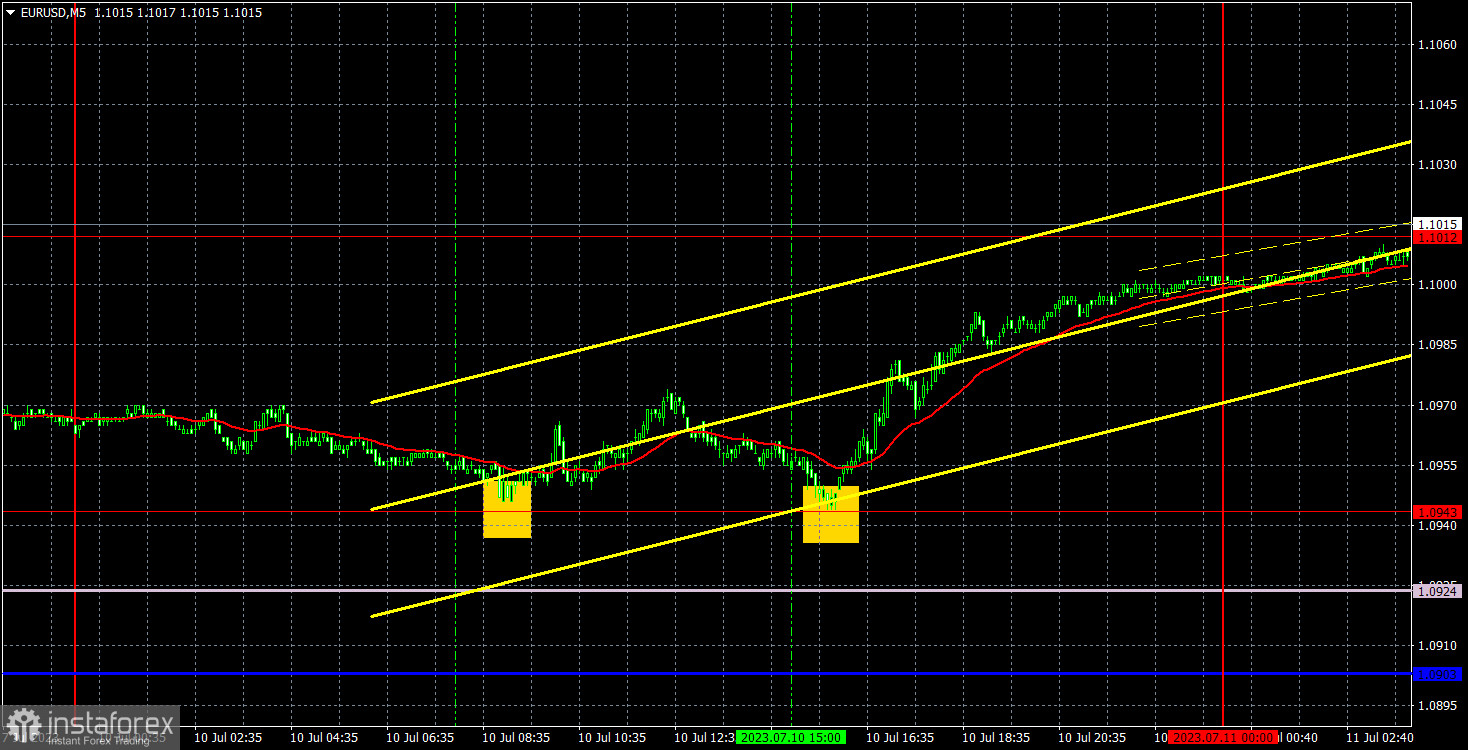
5M chart of EUR/USD
Moderate to low levels of EUR/USD volatility on Monday. This is in the absence of influential economic releases. Only the speeches by Federal Reserve officials could probably spur market participants, but the first one started almost in the evening, which means it could not affect the daily movements. Nevertheless, the euro drifted upwards almost without a correction after Friday's growth. Once again, we ask ourselves, why is the dollar falling, if the US published numbers that were not that bad? However, the market has its own view of the current situation and it seems to believe that the central bank will continue hiking interest rates in the coming months. Although some representatives of the European Central Bank are already hinting that the peak level is in sight.
For intraday traders, it basically doesn't matter why the pair was moving up or down. The main thing is that the movement and signals were good. And yesterday, there were two perfect buy signals. First, the pair rebounded from the 1.0943 level with minimal error, and then - once again. In the first case, the pair passed 17 pips in the correct direction, which was enough only to set a Stop Loss at break-even. In the second case, the pair grew by 40 pips, and the long position should have been closed manually, since there were no more entry points until the end of the day.
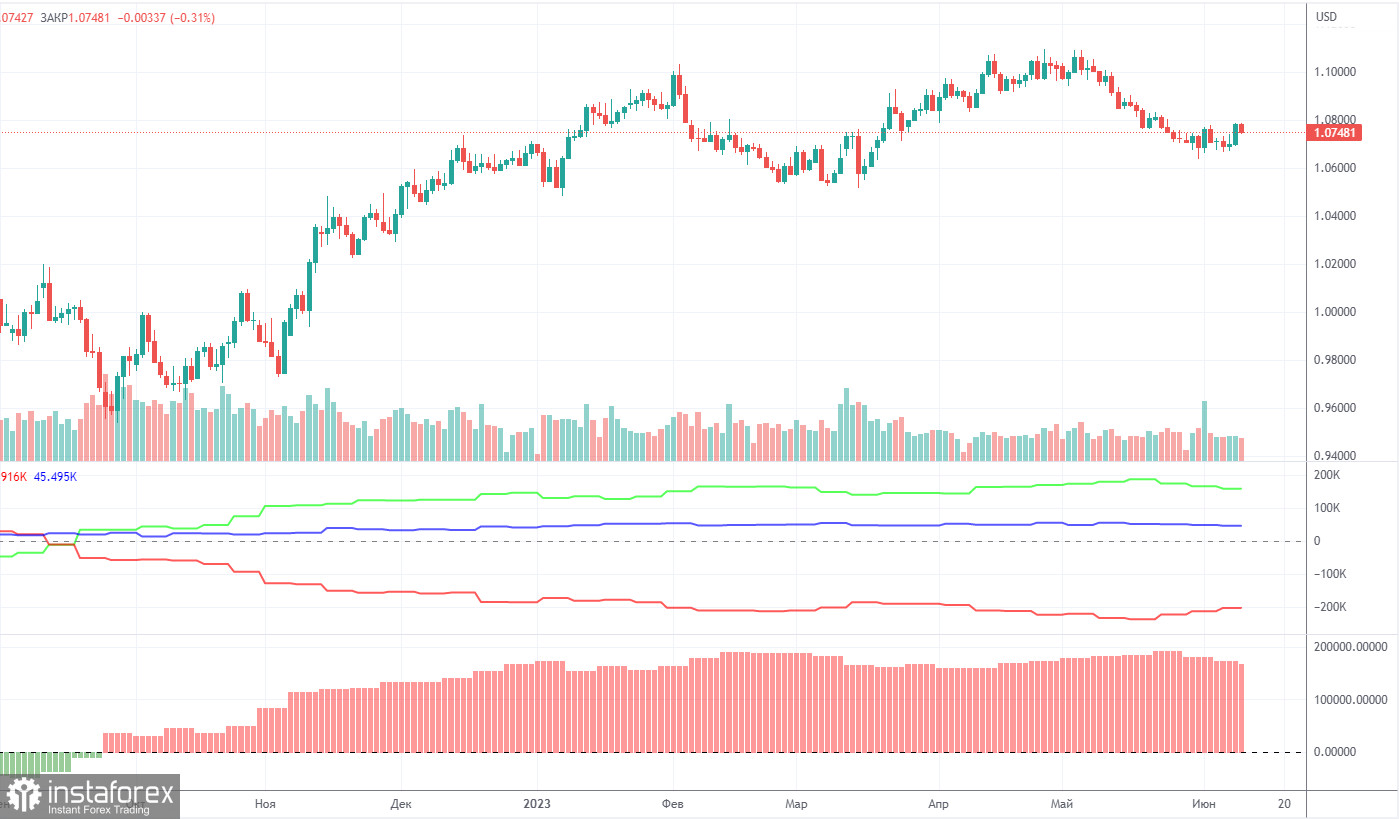
COT report:
On Friday, the new COT report for July 3 was released. Over the past 10 months, COT data has been in line with developments in the market. The net position of large traders (the second indicator on the chart) has been on the rise since September 2022. The euro started to show strength approximately at the same time. For the last 5 months, the net position is no longer growing, and the euro is not rising either. Currently, the net non-commercial position is bullish and keeps growing further. Meanwhile, the euro is still strong against the dollar.
We have repeatedly pointed out that a relatively high value of the net position suggests a potential end of the uptrend. This is shown by the first indicator, where the red and green lines have significantly diverged, which often precedes a trend reversal.
During the last reporting week, the number of long positions held by non-commercial traders decreased by 2,700 while the number of short positions fell by 500. As a result, the net position dropped by 2,200, which is very small. The number of long positions still exceeds the number of short ones by 143,000, an almost threefold gap. In principle, even without the COT reports, it's clear that the euro should fall, but the market is in no hurry to sell. Perhaps it fears a stronger increase in the ECB rate.
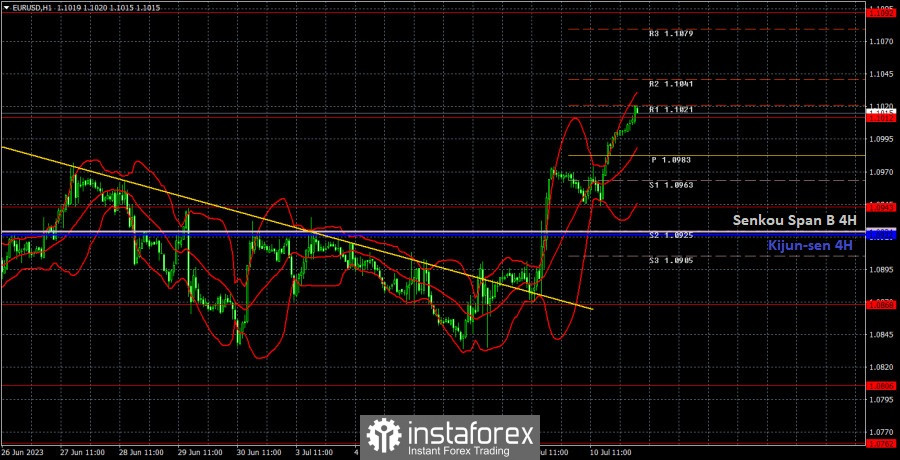
1H chart of EUR/USD
In the 1-hour chart, the pair broke through the descending trend line, breaking the downtrend. We don't believe that there are any bullish factors for the euro as of now, but downbeat US inflation expectations can weigh on the price, and we do not rule out that the market has already started to price in this report. Otherwise, it is impossible to explain the euro's growth on Monday.
On July 11, trading levels are seen at .0658-1.0669, 1.0762, 1.0806, 1.0868, 1.0943, 1.1012, 1.1092, 1.1137, as well as the Senkou Span B line (1.0924) and the Kijun-sen line (1.0922). Ichimoku indicator lines can move intraday, which should be taken into account when determining trading signals. There are also support and resistance although no signals are made near these levels. Signals could be made when the price either breaks or bounces from these extreme levels. Do not forget to place Stop Loss at the breakeven point when the price goes by 15 pips in the right direction. In case of a false breakout, it could save you from possible losses.
ZEW Economic Sentiment figures for Germany and the eurozone may draw interest. Meanwhile, FOMC member Bullard on the US calendar to speak today, who does not have the right to vote in the monetary committee when determining the key rate. Nevertheless, if the market has begun to price in the inflation report, it will continue to do so today.
Indicators on charts:
Resistance/support - thick red lines, near which the trend may stop. They do not make trading signals.
Kijun-sen and Senkou Span B are the Ichimoku indicator lines moved to the hourly timeframe from the 4-hour timeframe. They are also strong lines.
Extreme levels are thin red lines, from which the price used to bounce earlier. They can produce trading signals.
Yellow lines are trend lines, trend channels, and other technical patterns.
Indicator 1 on the COT chart is the size of the net position of each trader category.
Indicator 2 on the COT chart is the size of the net position for the Non-commercial group of traders.