Analysis of GBP/USD on the 5-minute chart
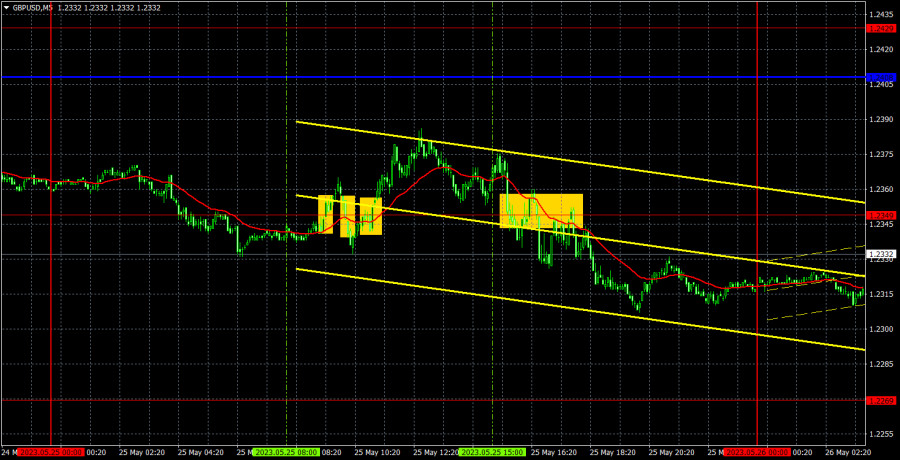
On Thursday, the pound/dollar pair declined again. The market volatility was quite low. There were frequent pullbacks and upward corrections. The nature of the movement remains unchanged. A fairly strong downward trend persists but the intraday movements are very unfavorable for short-term trading. In other words, there is a trend but it is almost impossible to profit from it intraday. It is better to use a medium-term approach at the moment. Yesterday, only reports from overseas could have had a slight impact on the pair. However, the dollar has been rising for two consecutive weeks even without these reports. Therefore, even if the macroeconomic calendar was empty, the pair would continue to decline.
Yesterday's trading signals left much to be desired. All of them were formed around the level of 1.2349, which is a clear sign of a flat market. In fact, there is no flat market at the moment, but the price constantly pulls back and corrects. That is why there are hardly any clear one-sided intraday movements. Traders could have attempted to use only the first two signals yesterday, but even setting a breakeven stop loss was not possible. It is better to use a medium-term approach, maintaining positions for several days.
COT report:
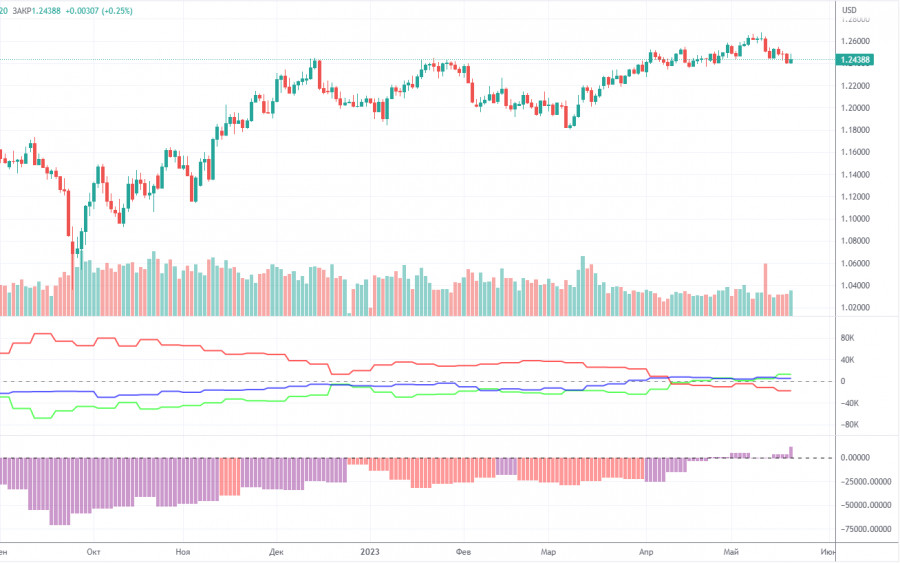
According to the latest report on the British pound, the non-commercial group opened 5.8 thousand BUY contracts and closed 2.2 thousand SELL contracts. Thus, the net position of non-commercial traders increased by 8 thousand contracts and continues to grow. The net position indicator has been steadily rising over the past 9-10 months, but the sentiment of major traders has been bearish throughout this time. Although the British pound is rising against the US dollar (in the medium-term period), it is very difficult to answer why it is doing so from a fundamental point of view. We do not exclude the possibility that a sharp decline in the pound may begin in the near future. It may have already started.
Both major currency pairs are showing the same dynamic at the moment. However, the net position for the euro is positive, implying the imminent completion of the upward impulse. Meanwhile, for the pound, it is neutral, which allows further growth. The British currency has risen by 2,300 pips, which is a significant increase. Without a strong downward correction, the continuation of the rally would be illogical (even if we ignore the lack of fundamental support). The non-commercial group is currently holding a total of 64.8 thousand sell contracts and 77.4 thousand buy contracts. We remain skeptical about the long-term growth in the British currency and expect it to decline. However, the upward inertial movement may continue for some time.
Analysis of GBP/USD on the one-hour chart
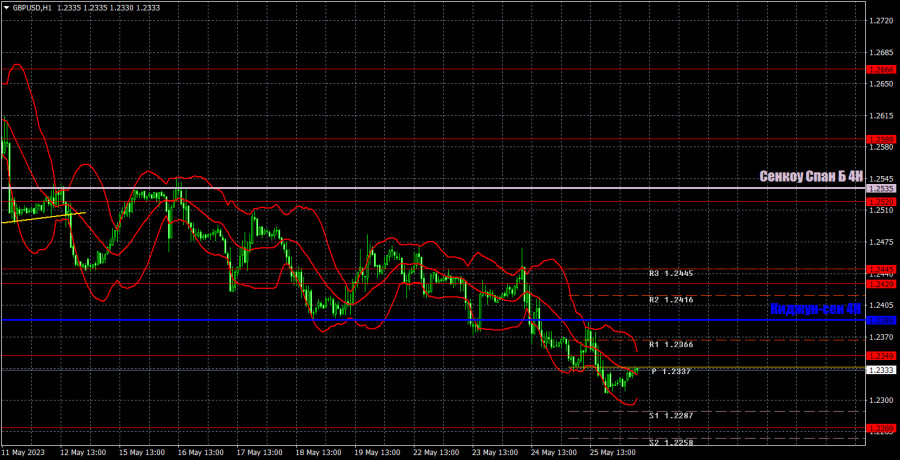
On the hourly time frame, the GBP/USD pair continues to lose value. The price is below all the lines of the Ichimoku indicator, which allows us to have greater confidence in the current downtrend. We still believe that the pair should continue moving downward. The macroeconomic data from Britain remains quite weak, while the data from the US is relatively good, providing additional reasons to sell the pound.
On May 26, we highlight the following important levels: 1.2188, 1.2269, 1.2349, 1.2429-1.2445, 1.2520, 1.2589, 1.2666. The Senkou Span B line (1.2535) and the Kijun-sen line (1.2389) can also serve as sources of signals. Bounces or breakouts of these levels and lines could also provide signals. It is recommended to set the stop loss at breakeven when the price moves in the right direction by 20 pips. The lines of the Ichimoku indicator can shift during the day, which should be taken into account when determining trading signals. The illustration also includes support and resistance levels that can be used to take a profit.
On Friday, the UK will release a retail sales report, and the US will issue four relatively unimportant reports. Each individual report is unlikely to cause a strong market reaction, but the cumulative effect of the four US publications can influence traders' sentiment. However, we believe that they will not have a significant impact on the downward trend. At most, we may see an upward correction today, as the pair has been falling for two weeks.
What we see on the trading charts:
Support and resistance levels (resistance/support) are thick red lines where price movement may end. They are not sources of trading signals.
Kijun-sen and Senkou Span B lines are lines of the Ichimoku indicator transferred from the 4-hour time frame to the hourly time frame. They are strong lines.
Extreme levels are thin red lines from which the price previously rebounded. They are sources of trading signals.
Yellow lines are trendlines, trend channels, and any other technical patterns.
Indicator 1 on the COT chart reflects the size of the net position for each category of traders.
Indicator 2 on the COT charts points to the size of the net position for the non-commercial group.


