empty
25.05.2023 12:10 PM
EUR/USD and GBP/USD: Technical analysis for May 25

EUR/USD

This image is no longer relevant

Higher timeframes

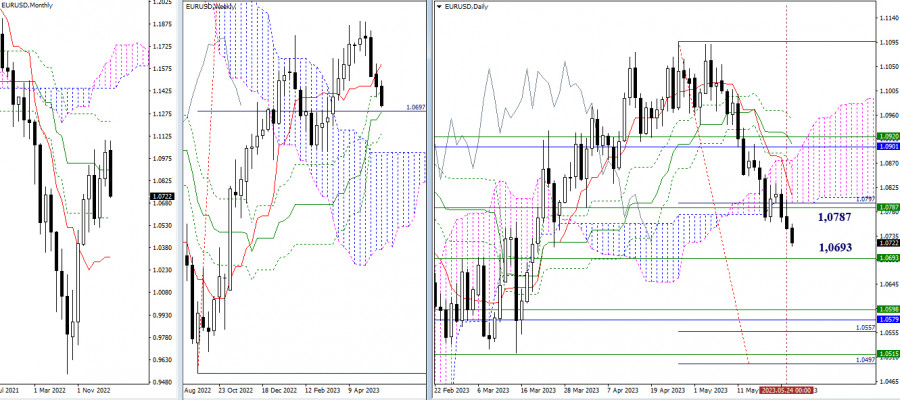
Bears have set new lows and continue to develop a downward movement. On their way, they face support from the weekly medium-term trend (1.0693). Overcoming this level will open up possibilities for further decline towards an important and wide zone where significant reference points have accumulated. A halt or a rebound from 1.0693 could signal the end of the downward process and bring bullish activity back into the market. In this case, the nearest reference point would be the area that combines daily and weekly levels: 1.0787 – 1.0796 – 1.0811.

This image is no longer relevant

H4 – H1

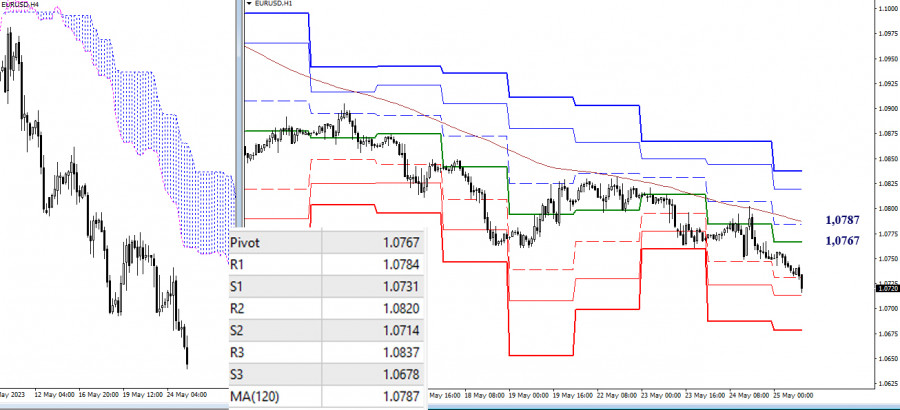
A bearish trend is also observed on the lower timeframes. Bears maintain the main advantage due to resistance from the weekly trend. Currently, the support of the S2 classic pivot points (1.0714) is being tested, with the next reference point being the S3 level. Key levels today are holding the defense at the boundaries of 1.0767 – 1.0787 (central pivot point + weekly long-term trend).

***

GBP/USD

This image is no longer relevant

Higher timeframes

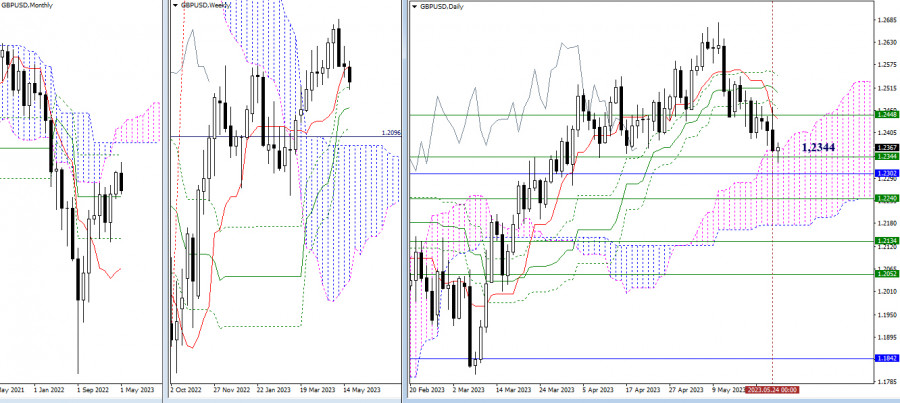
Currently, the pair is testing the support levels of 1.2344 – 1.2361 (weekly level + upper boundary of the daily cloud). A rebound and a recovery of positions could bring the pound back into the zone of recent consolidation, with the center of attraction around the weekly short-term trend (1.2448). Breaking through the encountered levels will pass the baton to the supports located below: 1.2302 (monthly medium-term trend) – 1.2240 (weekly medium-term trend) – 1.2173 (lower boundary of the daily cloud).

This image is no longer relevant

H4 – H1

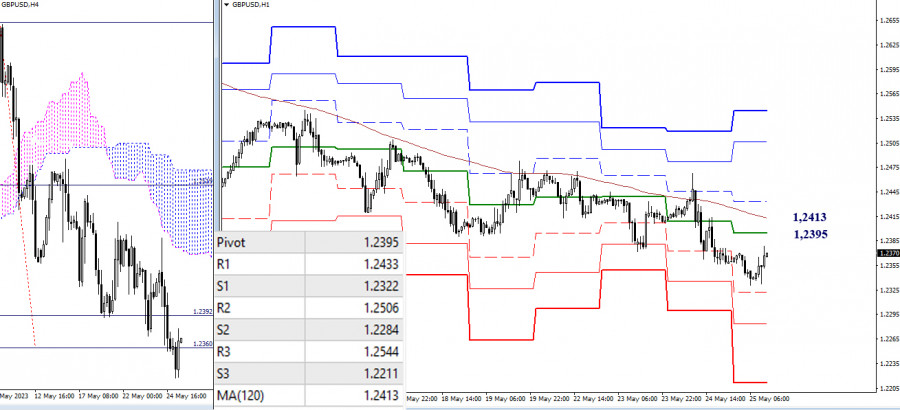
Currently, the bearish trend continues to develop. The intraday bearish reference points today are the supports of the classic pivot points at 1.2322 – 1.2284 – 1.2211. The key levels on the lower timeframes are currently forming resistances in case of a full-blown correction, situated around 1.2395 – 1.2413 (central pivot point of the day + weekly long-term trend). Consolidation above these levels could shift the current balance of power, opening the way to bullish reference points at 1.2433 – 1.2506 – 1.2544 (resistances of the classic pivot points).

The technical analysis of the situation uses:

Higher timeframes - Ichimoku Kinko Hyo (9.26.52) + Fibo Kijun levels

Lower timeframes - H1 - Pivot Points (classic) + Moving Average 120 (weekly long-term trend)

Evangelos Poulakis,
Analytical expert of InstaForex
© 2007-2025
Select timeframe
5
min
15
min
30
min
1
hour
4
hours
1
day
1
week
Earn on cryptocurrency rate changes with InstaForex
Download MetaTrader 4 and open your first trade
  • Grand Choice
    Contest by
    InstaForex
    InstaForex always strives to help you
    fulfill your biggest dreams.
    JOIN CONTEST

Recommended Stories

Technical Analysis of Intraday Price Movement of S&P 500, Thursday January 23, 2025.

Although the price movement of the S&P 500 index is above the SMA (200) which has a slope that slopes upwards which indicates that buyers are still dominant

Arief Makmur 06:15 2025-01-23 UTC+2

Technical Analysis of Daily Price Movement of Silver Commodity Instrument, Thursday January 23, 2025.

With the appearance of the Failing Wedge Pattern and Divergence between the movement of Silver prices with the Awesome Oscillator indicator and the presence of the Bullish 123 pattern followed

Arief Makmur 06:15 2025-01-23 UTC+2

Forecast for EUR/USD on January 23, 2025

Yesterday, the euro peaked at 1.0458. We previously identified a target level of 1.0461, based on the low from December 2; however, this can now be adjusted to the December

Laurie Bailey 04:45 2025-01-23 UTC+2

Forecast for GBP/USD on January 23, 2025

On Wednesday, the British pound reached the target level of 1.2367 before following the broader market downward. The Marlin oscillator on the daily timeframe has not yet hit the boundary

Laurie Bailey 04:45 2025-01-23 UTC+2

Forecast for AUD/USD on January 23, 2025

The Australian dollar has closed at the same level as its opening price for two consecutive days, indicating price consolidation around the 0.6273 level. In addition to the price

Laurie Bailey 04:45 2025-01-23 UTC+2

Trading Signals for GOLD (XAU/USD) for January 22-25, 2025: sell below $2,760 (21 SMA - 7/8 Murray)

Early in the American session, Gold is trading around 2,755, above 6/8 Murray, and with a bullish bias. As a result, we are going to see a technical correction

Dimitrios Zappas 14:58 2025-01-22 UTC+2

Trading Signals for EUR/USD for January 22-25, 2025: buy above 1.0376 or sell below 1.0460 (21 SMA - 5/8 Murray)

Below the 21SMA and below 5/8 Murray, the outlook could turn negative for the euro. So, EUR/USD could return below the bearish channel to reach 4/8 Murray at 1.0253

Dimitrios Zappas 14:56 2025-01-22 UTC+2

Forex forecast 22/01/2025: EUR/USD, GBP/USD, USD/CAD, Oil and Bitcoin

Video Agenda: 00:00 INTRO 00:13 Totay's key events: CPI, Interest Rate, World Economic Forum Annual Meetings, ECB President Lagarde Speaks, API Weekly Crude Oil Stock 01:19 EUR/USD 03:22 GBP/USD 04:34

Sebastian Seliga 12:42 2025-01-22 UTC+2

EUR/USD: January 22nd. Bulls Persist in Trying to Take Control

On Tuesday, the EUR/USD pair declined to the support zone of 1.0336–1.0346, rebounded from it, reversed in favor of the euro, and rose to the resistance zone of 1.0435–1.0448

Samir Klishi 11:25 2025-01-22 UTC+2

Forecast for GBP/USD on January 22, 2025

On the hourly chart, the GBP/USD pair reversed in favor of the pound on Tuesday and rose nearly to the resistance zone of 1.2363–1.2370. However, the pair fell short

Samir Klishi 11:21 2025-01-22 UTC+2
Can't speak right now?
Ask your question in the chat.
Widget callback
 

Dear visitor,

Your IP address shows that you are currently located in the USA. If you are a resident of the United States, you are prohibited from using the services of InstaFintech Group including online trading, online transfers, deposit/withdrawal of funds, etc.

If you think you are seeing this message by mistake and your location is not the US, kindly proceed to the website. Otherwise, you must leave the website in order to comply with government restrictions.

Why does your IP address show your location as the USA?

  • - you are using a VPN provided by a hosting company based in the United States;
  • - your IP does not have proper WHOIS records;
  • - an error occurred in the WHOIS geolocation database.

Please confirm whether you are a US resident or not by clicking the relevant button below. If you choose the wrong option, being a US resident, you will not be able to open an account with InstaForex anyway.

We are sorry for any inconvenience caused by this message.