empty
03.01.2023 07:26 AM
Outlook and trading signals for EUR/USD on January 3. COT report. Analysis of market situation. The euro continues to celebrate the New Year.

M5 chart of EUR/USD

This image is no longer relevant

EUR/USD continued trading with low volatility and mainly sideways on Monday. It showed a slight growth during the final days of 2022, but as a whole remained within the horizontal channel. And on Monday the technical picture didn't change at all. There are still very few fundamental events and macro data. For example, yesterday, the final purchasing manager's index for manufacturing in December was published in Germany. Naturally, it did not provoke any market reaction. More or less important data will be available closer to the end of the week and then we would expect more serious moves. But I warned you last week that the flat may take much longer than many expected. I wouldn't be surprised if it lasts another 2 or 3 weeks.

There was only one trading signal and it was very good. There's always a risk of false signals when facing a flat, so the less of them, the better. The pair rebounded from 1.0669 during the European session, but it failed to go up even 15 pips. Basically, in an hour after this signal was formed it was clear that there would be no movement on Monday, so the position could be closed manually with small profit.

COT report

This image is no longer relevant

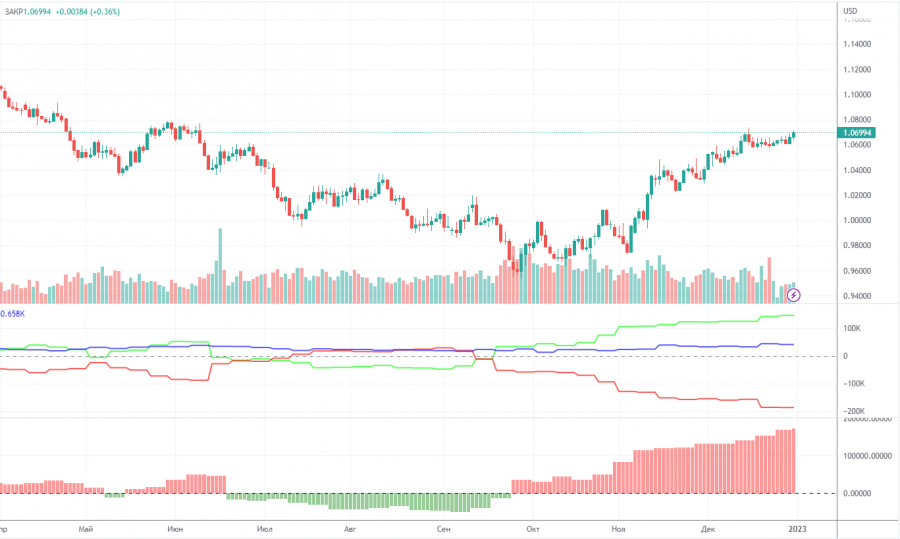
The COT reports for the euro in the last few months have been fully consistent with what is happening in the market. You can clearly see on the chart that the net position of big players (the second indicator) has been growing since early September. Around the same time, the euro started to grow. At this time, the net position of the non-commercial traders has been bullish and strengthens almost every week, but it is a rather high value that allows us to assume that the upward movement will end soon. Notably, the green and red lines of the first indicator have moved far apart from each other, which often means the end of the trend. During the given period, non-commercial traders opened 2,700 long positions, whereas the number of short positions fell by 1,100. Thus, the net positions rose by 3,800. The number of long positions is 146,000 higher than the number of short positions opened by non-commercial traders. So the question now is how long will the big players increase their longs? Moreover, from a technical perspective, a bearish correction should have started a long time ago. In my opinion, this process can not continue for another 2 or 3 months. Even the net position indicator shows that we need to "unload" a bit, that is, to correct. The overall number of short orders exceeds the number of long orders by 41,000 (685,000 vs. 644,000).

H1 chart of EUR/USD

This image is no longer relevant

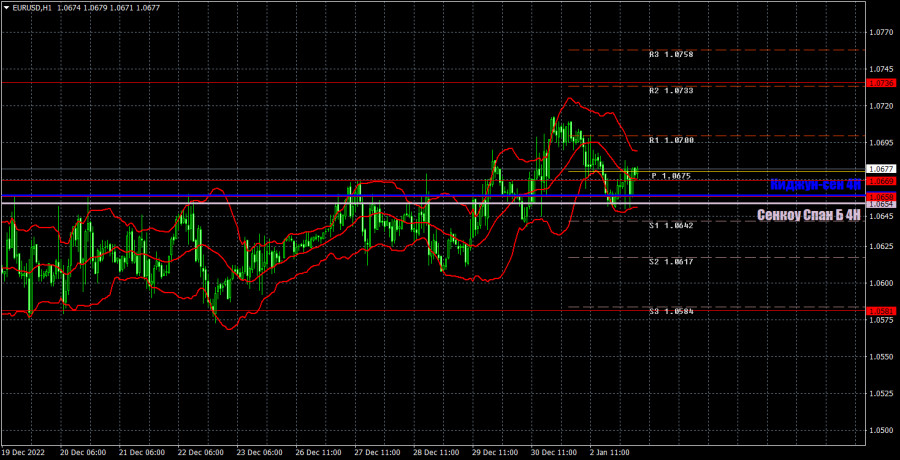
EUR/USD is still in a very high position on the one-hour chart, and is still in a flat. Lines of the Ichimoku indicator are very close to each other and have lost meaning. The pair can cross them easily and freely now because it's in a horizontal channel. Therefore, I can't say anything new about the technical picture at the moment. On Tuesday, the pair may trade at the following levels: 1.0340-1.0366, 1.0485, 1.0581, 1.0658-1.0669, 1.0736, 1.0806, as well as Senkou Span B (1.0654) and Kijun Sen (1.0660). Lines of the Ichimoku indicator may move during the day, which should be taken into account when determining trading signals. There are also support and resistance levels, but signals are not formed near these levels. Bounces and breakouts of the extreme levels and lines could act as signals. Don't forget about stop-loss orders, if the price covers 15 pips in the right direction. This will prevent you from losses in case of a false signal. On January 3, the US will release its manufacturing activity report for December (final value). I don't expect a significant reaction from the market. The flat will likely persist.

What we see on the trading charts:

Price levels of support and resistance are thick red lines, near which the movement may end. They do not provide trading signals.

The Kijun-sen and Senkou Span B lines are the lines of the Ichimoku indicator, moved to the one-hour chart from the 4-hour one. They are strong lines.

Extreme levels are thin red lines from which the price bounced earlier. They provide trading signals.

Yellow lines are trend lines, trend channels, and any other technical patterns.

Indicator 1 on the COT charts reflects the net position size of each category of traders.

Indicator 2 on the COT charts reflects the net position size for the non-commercial group.

Paolo Greco,
Analytical expert of InstaForex
© 2007-2025
Select timeframe
5
min
15
min
30
min
1
hour
4
hours
1
day
1
week
Earn on cryptocurrency rate changes with InstaForex
Download MetaTrader 4 and open your first trade
  • Grand Choice
    Contest by
    InstaForex
    InstaForex always strives to help you
    fulfill your biggest dreams.
    JOIN CONTEST

Recommended Stories

GBP/USD: Trading Plan for the U.S. Session on June 10th (Review of Morning Trades)

In my morning forecast, I drew attention to the 1.3545 level and planned to base market entry decisions on it. Let's look at the 5-minute chart to see what happened

Miroslaw Bawulski 18:26 2025-06-10 UTC+2

EUR/USD: Trading Plan for the U.S. Session on June 10th (Review of Morning Trades)

In my morning forecast, I highlighted the level of 1.1388 and planned to make market entry decisions based on it. Let's take a look at the 5-minute chart

Miroslaw Bawulski 18:22 2025-06-10 UTC+2

How to Trade the GBP/USD Pair on June 10? Simple Tips and Trade Analysis for Beginners

Analysis of Monday's Trades 1H Chart of GBP/USD The GBP/USD pair also traded in both directions on Monday. On Friday, the price consolidated below the ascending trendline, formally changing

Paolo Greco 06:40 2025-06-10 UTC+2

How to Trade the EUR/USD Pair on June 10? Simple Tips and Trade Analysis for Beginners

Analysis of Monday's Trades 1H Chart of EUR/USD The EUR/USD currency pair traded with low volatility and in both directions on Monday. That day, the macroeconomic backdrop was practically absent

Paolo Greco 06:40 2025-06-10 UTC+2

Trading Recommendations and Analysis for GBP/USD on June 10: The Pound Is in No Hurry to Fall Either

On Monday, the GBP/USD currency pair predictably failed to continue its downward movement. Recall that earlier, the price again formed a signal for a trend reversal to bearish—a consolidation below

Paolo Greco 04:11 2025-06-10 UTC+2

Trading Recommendations and Analysis for EUR/USD on June 10: Another Day, Another Dose of Negativity

The EUR/USD currency pair traded mixed throughout Monday. Despite breaking through the trendline, the downward movement (i.e., strengthening the US dollar) never actually began. Thus, technical signals still hold little

Paolo Greco 04:11 2025-06-10 UTC+2

GBP/USD: Trading Plan for the U.S. Session on June 9th (Analysis of Morning Trades)

In my morning forecast, I focused on the 1.3581 level and planned to base entry decisions around it. Let's look at the 5-minute chart and see what happened. The rise

Miroslaw Bawulski 14:16 2025-06-09 UTC+2

EUR/USD: Trading Plan for the U.S. Session on June 9th (Analysis of Morning Trades)

In my morning forecast, I focused on the 1.1430 level and planned to base entry decisions around it. Let's look at the 5-minute chart and see what happened. The pair

Miroslaw Bawulski 14:09 2025-06-09 UTC+2

How to Trade the GBP/USD Pair on June 9? Simple Tips and Trade Analysis for Beginners

Analysis of Friday's Trades 1H Chart of GBP/USD The GBP/USD pair also traded lower on Friday for the same reasons as the EUR/USD pair. The dollar received minimal market support

Paolo Greco 05:54 2025-06-09 UTC+2

How to Trade the EUR/USD Pair on June 9? Simple Tips and Trade Analysis for Beginners

Analysis of Friday's Trades 1H Chart of EUR/USD The EUR/USD currency pair traded lower on Friday, and there were objective reasons for this. However, it's important to note that

Paolo Greco 05:54 2025-06-09 UTC+2
Can't speak right now?
Ask your question in the chat.
Widget callback
 

Dear visitor,

Your IP address shows that you are currently located in the USA. If you are a resident of the United States, you are prohibited from using the services of InstaFintech Group including online trading, online transfers, deposit/withdrawal of funds, etc.

If you think you are seeing this message by mistake and your location is not the US, kindly proceed to the website. Otherwise, you must leave the website in order to comply with government restrictions.

Why does your IP address show your location as the USA?

  • - you are using a VPN provided by a hosting company based in the United States;
  • - your IP does not have proper WHOIS records;
  • - an error occurred in the WHOIS geolocation database.

Please confirm whether you are a US resident or not by clicking the relevant button below. If you choose the wrong option, being a US resident, you will not be able to open an account with InstaForex anyway.

We are sorry for any inconvenience caused by this message.