empty
30.11.2022 01:09 PM
EUR/USD and GBP/USD trading plan and analysis for beginners on November 30, 2022

Economic calendar on November 29

Yesterday, the UK posted data on mortgage approvals and net lending to individuals. The data came out worse than expected. The number of approved mortgage loans was 58,000 against 65,000 a month earlier, while the figure was forecasted at 60,000. The volume of mortgage lending amounted to only £3.97 billion, while last month it was £5.88 billion. All indications confirm that the mortgage market is declining along with the real estate market. These factors are putting pressure on the industry.

As a result, bears put significant pressure on the British pound.

Overview of technical charts on November 29

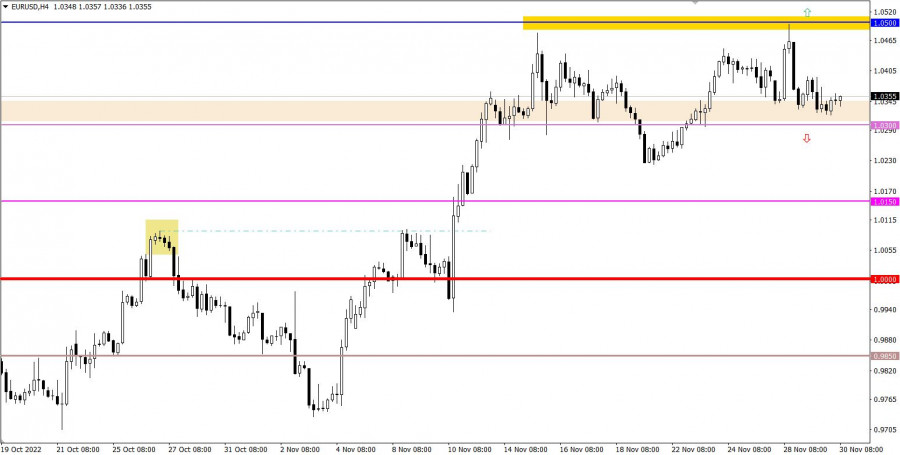
Yesterday, the EUR/USD pair declined slightly. The price approached the support level of 1.0300.

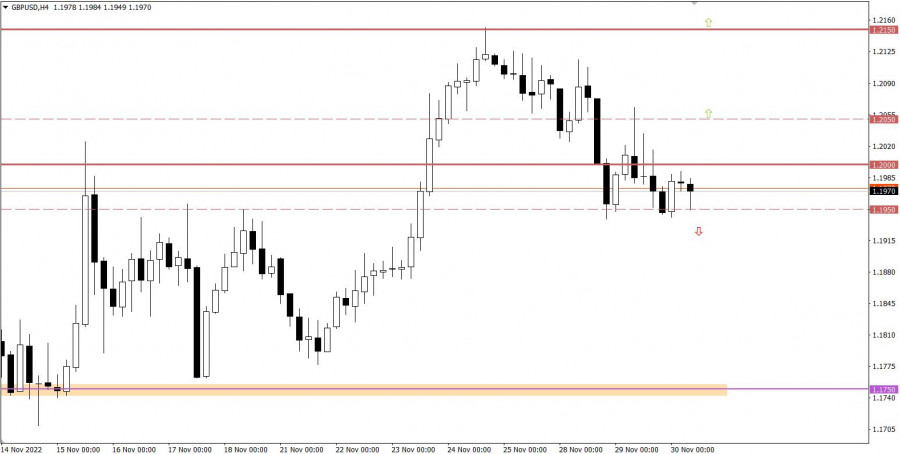
During the previous trading day, the GBP/USD pair was hovering near the psychologically important area of 1.1950-1.2000. This confirmed the fact that traders were considering short positions on the British pound.

This image is no longer relevant

Economic calendar on November 30

Today, the market expects important statistics on inflation in the euro area. The consumer price growth is expected to slow down to 10.3% from 10.6%. If these expectations are confirmed, the euro might experience much more pressure. It means that the ECB may consider slowing the pace of interest rate hikes following the Fed's steps.

Timing

EU Consumer Price Index – 10:00 GMT

Trading plan for EUR/USD on November 30

Currently, the pair is trading between 1.0300 and 1.0500. It can be assumed that if the price settles beyond one of these levels on the 4-hour chart, it will indicate the trend in the market. Before that, one may open positions on rebounds.

This image is no longer relevant

Trading plan for GBP/USD on November 30

The price needs to fix below 1.1950 on the 4-hour chart to continue the current downtrend. This downward movement started at the end of the last week. Following this scenario, the British pound may drop to 1.1750.

We may speak about an uptrend only after the quotes fix above 1.2050 on the 4-hour chart. In this case, the price may return to the swing high of 1.2150 which is offering resistance.

This image is no longer relevant

What's on the chart

The candlestick chart type is white and black graphic rectangles with lines above and below. With a detailed analysis of each individual candlestick, you can see its characteristics relative to a particular time frame: the opening price, closing price, and intraday high and low.

Horizontal levels are price coordinates, relative to which a price may stop or reverse its trajectory. In the market, these levels are called support and resistance.

Circles and rectangles are highlighted examples where the price reversed in history. This color highlighting indicates horizontal lines that may put pressure on the asset's price in the future.

The up/down arrows are landmarks of the possible price direction in the future.

Gven Podolsky,
Analytical expert of InstaForex
© 2007-2025
Select timeframe
5
min
15
min
30
min
1
hour
4
hours
1
day
1
week
Earn on cryptocurrency rate changes with InstaForex
Download MetaTrader 4 and open your first trade
  • Grand Choice
    Contest by
    InstaForex
    InstaForex always strives to help you
    fulfill your biggest dreams.
    JOIN CONTEST

Recommended Stories

GBP/USD: Plan for the American Session on January 20 (Review of Morning Trades). The Pound Faces Continued Challenges

In my morning forecast, I highlighted the 1.2162 level as a key decision point for market entry. Let's analyze the 5-minute chart to see what transpired. A decline

Miroslaw Bawulski 14:15 2025-01-20 UTC+2

EUR/USD: Trading Plan for the U.S. Session on January 20th (Review of Morning Trades)

In my morning forecast, I highlighted the 1.0322 level as a key decision point for market entry. Let's look at the 5-minute chart to see what happened. The rise

Miroslaw Bawulski 14:01 2025-01-20 UTC+2

Margin Zones and Trading Ideas for S&P 500 and NASDAQ (January 20, 2025 - January 24, 2025)

Long-Term Trend: Temporary uncertainty. For buying opportunities, wait for a zig-zag pattern and a breakout above 6099.43. For selling opportunities, wait for a zig-zag pattern and a breakout below 5790.81

08:32 2025-01-20 UTC+2

Trading Recommendations and Analysis for GBP/USD on January 20: The Pound Targets 1.1800 Again

The GBP/USD currency pair continued its downward trend on Friday. While a weak upward correction was observed on the hourly timeframe, the British pound is gradually sliding towards its lowest

Paolo Greco 02:56 2025-01-20 UTC+2

Trading Recommendations and Analysis for EUR/USD on January 20: Flat Movement Continues

The EUR/USD currency pair traded within a narrow range on Friday. On the hourly timeframe, the movement appears flat; however, on the 4-hour timeframe, it is evident that the pair

Paolo Greco 02:56 2025-01-20 UTC+2

How to Trade the GBP/USD Pair on January 20? Simple Tips and Trade Analysis for Beginners

Analysis of Friday's Trades 1H Chart of GBP/USD The GBP/USD pair continued to trade within a local horizontal channel on Friday. However, the market activity we observed this week cannot

Paolo Greco 23:39 2025-01-19 UTC+2

How to Trade the EUR/USD Pair on January 20? Simple Tips and Trade Analysis for Beginners

Analysis of Friday's Trades 1H Chart of EUR/USD The EUR/USD currency pair traded sideways on Friday. While we don't consider the euro to be in a flat market just

Paolo Greco 23:39 2025-01-19 UTC+2

GBP/USD: Trading Plan for the U.S. Session on January 17th (Review of Morning Trades)

In my morning forecast, I focused on the 1.2178 level as a key point for market entry decisions. Let's analyze the 5-minute chart and see what happened. A decline followed

Miroslaw Bawulski 11:50 2025-01-17 UTC+2

EUR/USD: Trading Plan for the U.S. Session on January 17th (Review of Morning Trades)

In my morning forecast, I focused on the 1.0287 level as a key point for market entry decisions. Let's analyze the 5-minute chart to see what happened. The price decline

Miroslaw Bawulski 11:47 2025-01-17 UTC+2

How to Trade the GBP/USD Pair on January 17? Simple Tips and Trade Analysis for Beginners

Analysis of Thursday's Trades 1H Chart of GBP/USD On Thursday, the GBP/USD pair exhibited low volatility and mostly moved sideways. This week has brought an unusual amount of notable reports

Paolo Greco 06:35 2025-01-17 UTC+2
Can't speak right now?
Ask your question in the chat.
Widget callback
 

Dear visitor,

Your IP address shows that you are currently located in the USA. If you are a resident of the United States, you are prohibited from using the services of InstaFintech Group including online trading, online transfers, deposit/withdrawal of funds, etc.

If you think you are seeing this message by mistake and your location is not the US, kindly proceed to the website. Otherwise, you must leave the website in order to comply with government restrictions.

Why does your IP address show your location as the USA?

  • - you are using a VPN provided by a hosting company based in the United States;
  • - your IP does not have proper WHOIS records;
  • - an error occurred in the WHOIS geolocation database.

Please confirm whether you are a US resident or not by clicking the relevant button below. If you choose the wrong option, being a US resident, you will not be able to open an account with InstaForex anyway.

We are sorry for any inconvenience caused by this message.