On Monday, the EUR/USD currency pair traded relatively restrainedly but moved in both directions. This behavior was unexpected for the day, although describing the movements as significant would be hard. A better description would be "confusing." There were no notable events or reports during the week's first trading day, leaving the market with little to react to. However, at least three factors are currently influencing the market.
Last week featured a series of important reports, not all favorable for the dollar. For instance, the unemployment rate and the ISM Services PMI data were disappointing. However, there were more positive developments, including the Nonfarm Payrolls report, the ISM Manufacturing PMI, ADP employment data, JOLTs job openings, and the University of Michigan consumer sentiment index. Given this, last week's decline in the U.S. dollar was somewhat unusual. However, corrections are inherently technical and are expected to occur occasionally. This suggests that technical factors primarily drove the pair's recent movements.
If this is the case, the technical factors have played out, while the macroeconomic ones have not. Consequently, we may see the U.S. dollar strengthen this week. If this week reveals another acceleration in inflation, it could strongly indicate that the Federal Reserve will not lower its rate in the upcoming meeting in a week and a half. This, in turn, would provide solid grounds for a new wave of U.S. dollar strengthening.
The overall fundamental context remains the same: the European Central Bank is cutting its rate even faster than the Fed. Moreover, the ECB's rate started at 1% lower than the Fed's. So far, the market has been primarily reacting to the Fed's monetary policy easing. However, we believe a 500-600 pip drop in EUR/USD is insufficient to consider the pair balanced.
A global technical factor is also in play: the long-term trend remains bearish. Discussions about a long-term rise in the euro can only begin once there are clear indications that this trend has ended. No such indications exist, nor are there fundamental reasons to expect further euro growth that could break the trend.
The upward correction may continue longer, particularly if U.S. inflation does not show signs of acceleration this week. However, the overarching principle remains the same: any growth at this stage is merely a correction.
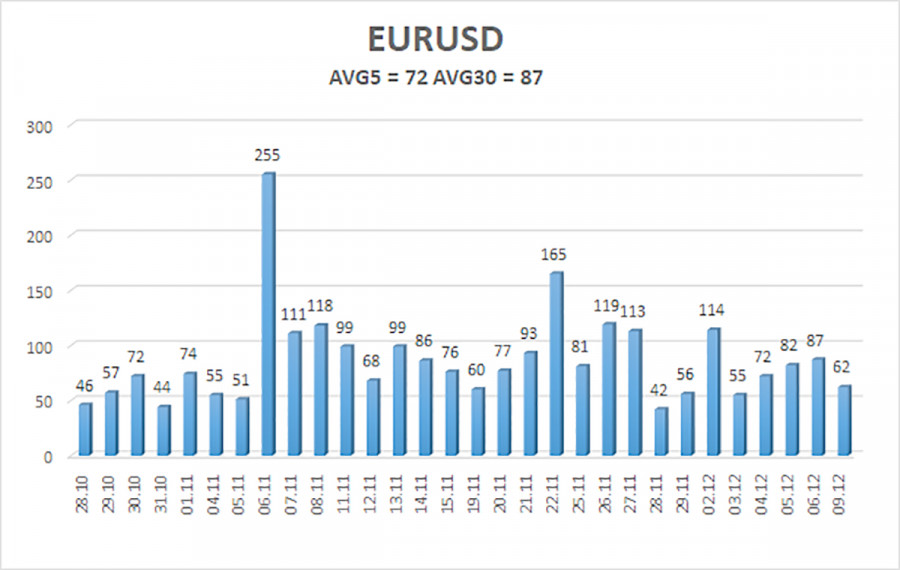
As of December 10, the average volatility of the EUR/USD currency pair over the last five trading days stands at 72 pips, which is classified as "moderate." On Tuesday, we expect the pair to move from 1.0492 to 1.0636. The higher linear regression channel points downward, indicating that the global downtrend remains intact. The CCI indicator has entered the oversold zone several times, triggering an upward correction, which is still ongoing.
Nearest Support Levels:
- S1: 1.0498
- S2: 1.0376
- S3: 1.0254
Nearest Resistance Levels:
- R1: 1.0620
- R2: 1.0742
- R3: 1.0864
Trading Recommendations:
The EUR/USD pair may resume its downtrend at any moment. In recent months, we have consistently noted that we expect only declines in the euro in the medium term and continue to support the overall bearish trend direction fully. The market is highly likely to have already priced in most or all of the anticipated Fed rate cuts. If so, the dollar has little to no reason for a medium-term decline, as it had few reasons before. Short positions can be considered with targets at 1.0376 and 1.0254 once the price consolidates below the moving average. If trading is based on "pure" technicals, long positions can be considered if the price is above the moving average, with targets at 1.0620 and 1.0636. However, we do not recommend opening long positions at this time.
Explanation of Illustrations:
Linear Regression Channels help determine the current trend. If both channels are aligned, it indicates a strong trend.
Moving Average Line (settings: 20,0, smoothed) defines the short-term trend and guides the trading direction.
Murray Levels act as target levels for movements and corrections.
Volatility Levels (red lines) represent the likely price range for the pair over the next 24 hours based on current volatility readings.
CCI Indicator: If it enters the oversold region (below -250) or overbought region (above +250), it signals an impending trend reversal in the opposite direction.


