GBP/USD 5-Minute Analysis
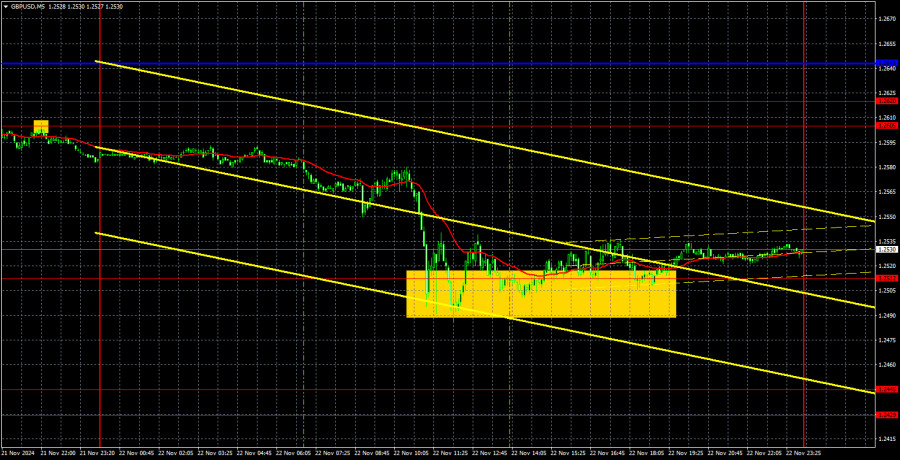
The GBP/USD currency pair continued its downward movement on Friday. It's worth noting that the pound declined much less during the day than the euro, even though UK reports were equally disappointing. Both business activity indices dropped significantly, which was unexpected by the market, and the retail sales report showed a decline in volumes. While this may benefit inflation, it will unlikely bode well for the economy. Thus, the latest drop in the British currency seems entirely justified. Furthermore, we believe the pound should continue to fall even without immediate macroeconomic support—a stance we've maintained for two months now, consistently observing the pound's persistent downward trend.
It's unlikely that the decline will end anytime soon "just because the pound has already fallen too much." The pound still has significant room for further declines in the weekly timeframe. Moreover, the recent two-month downward movement doesn't appear extreme. In the 4-hour timeframe, a correction seems due, but in the weekly timeframe, the pair could drop another 100 pips before any correction begins.
Sell signals were generated on Thursday in the 5-minute timeframe, and we mentioned that they could be carried over into the next day. The pair's movements have been such that corrections are almost non-existent. Therefore, it's unreasonable to expect that after breaking a certain level, the price will return to it, rebound, and then resume its decline. By the end of the day, the 1.2512 level was tested, providing an opportunity to lock in profits on long positions.
COT Report
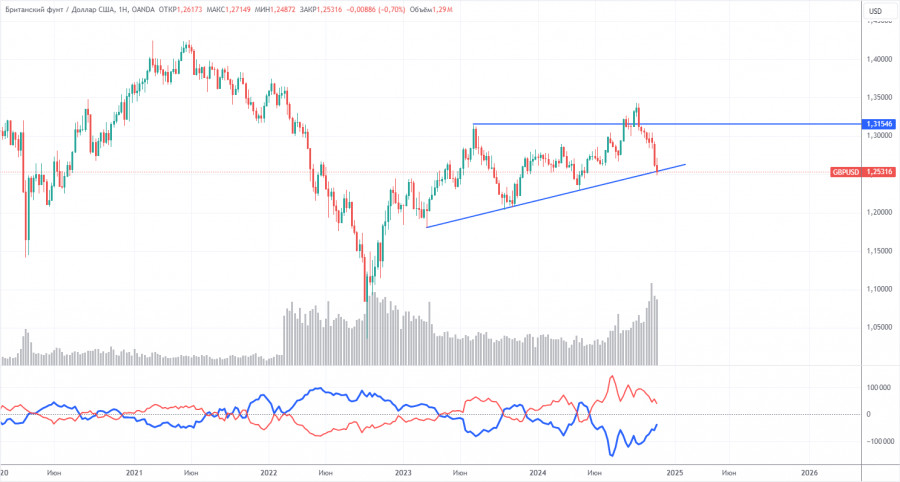
COT (Commitment of Traders) reports for the British pound show that commercial traders' sentiment has fluctuated over the years. The red and blue lines representing the net positions of commercial and non-commercial traders constantly cross and are often close to the zero mark. The latest downtrend occurred when the red line was below zero. The red line is above zero, while the price has breached the important 1.3154 level.
According to the latest COT report for the British pound, the Non-commercial group closed 18,300 BUY contracts and 2,500 SELL contracts, resulting in a 15,800 reduction in the net position for the week.
The fundamental backdrop still offers no basis for long-term pound purchases, and the currency remains at risk of resuming its global downtrend. There is an ascending trendline on the weekly timeframe, meaning a long-term fall cannot yet be confirmed. However, while the pound tested this trendline, it has yet to break below it. A rebound and correction in the long term remain possible, but we expect this trendline to be breached, with further declines to follow.
GBP/USD 1-Hour Analysis
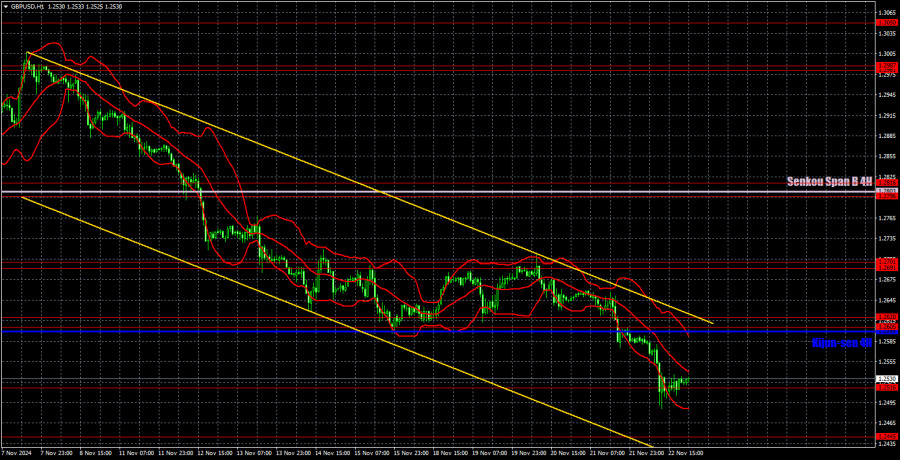
On the hourly timeframe, GBP/USD maintains its overall bearish tone. The previous uptrend has been invalidated, so further strong and prolonged declines in the British currency can be expected. The most recent correction was flat and has already ended. Another correction also turned out to be flat, but it has now concluded. There are still no fundamental reasons to anticipate significant growth in the pound. Even the inflation report from the UK provided no support to the currency.
For November 25, the following key levels are identified: 1.2429-1.2445, 1.2516, 1.2605-1.2620, 1.2796-1.2816, 1.2863, 1.2981-1.2987, and 1.3050. The Senkou Span B (1.2803) and Kijun-sen (1.2599) lines may also be signal sources. A Stop Loss order is recommended at breakeven after the price moves 20 pips in the desired direction. The Ichimoku indicator lines may shift throughout the day and should be considered when determining trading signals.
No major events are scheduled in the UK or the U.S. on Monday, meaning the market will focus on technical analysis. While we anticipate relatively calm movements for the day, the pound could continue its decline. It may serve as a sell signal if the price consolidates below 1.2516 on the hourly timeframe.
Illustration Explanations:
- Support and Resistance Levels (thick red lines): Key areas where price movement might stall. Not sources of trading signals.
- Kijun-sen and Senkou Span B Lines: Ichimoku indicator lines transferred from the H4 timeframe to the hourly chart, serving as strong levels.
- Extreme Levels (thin red lines): Points where the price has previously rebounded. They can serve as trading signal sources.
- Yellow Lines: Trendlines, channels, or other technical patterns.
- Indicator 1 on COT Charts: Reflects the net position size of each trader category.


