EUR/USD 5-Minute Analysis
The EUR/USD currency pair attempted a slight correction during Thursday's session but ultimately returned to its local lows by the end of the day. The macroeconomic background was relatively rich, but there were few genuinely significant reports. Among them, we can highlight the Eurozone GDP report, published as the second estimate, objectively the least important of all estimates. The Eurozone industrial production report, which unsurprisingly underperformed forecasts, also caught attention. As a result, the U.S. dollar could continue its rally, which has been ongoing for over a month and a half, even during the European session.
Later in the day, traders awaited Jerome Powell's speech. The Fed Chair reiterated that inflation is the key indicator the Federal Reserve considers when making monetary policy decisions. He noted that the stable labor market is no longer contributing to inflationary pressures. Powell praised the state of the U.S. economy and stated that the Fed does not need to reduce the key rate quickly. Thus, Powell's speech was clearly hawkish or "moderately hawkish," which immediately led to further strengthening of the U.S. dollar. Moreover, the dollar can now comfortably continue to rise as the market is convinced that the Fed will not cut rates as quickly as previously expected throughout 2024.
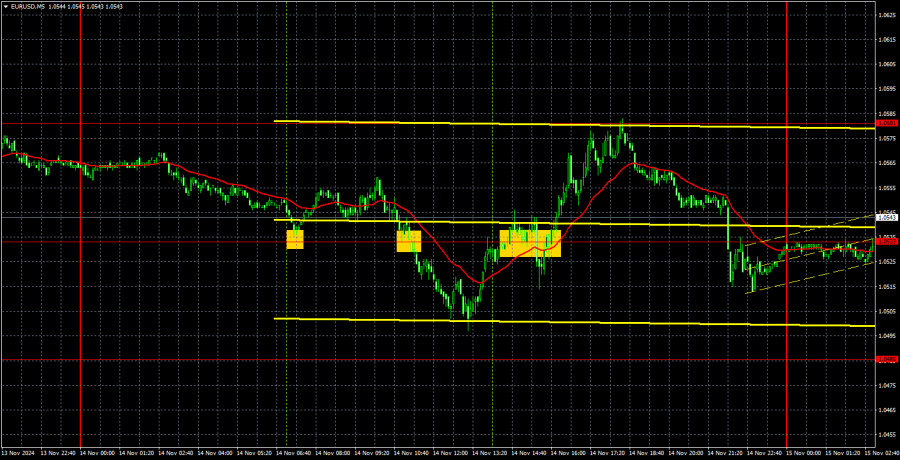
The trading signals yesterday were outright poor. Traders ignored the 1.0533 level, and the pair's rise was not triggered by any events, making it difficult to predict. These trading signals likely did not result in losses but hardly yielded any profits.
COT Report
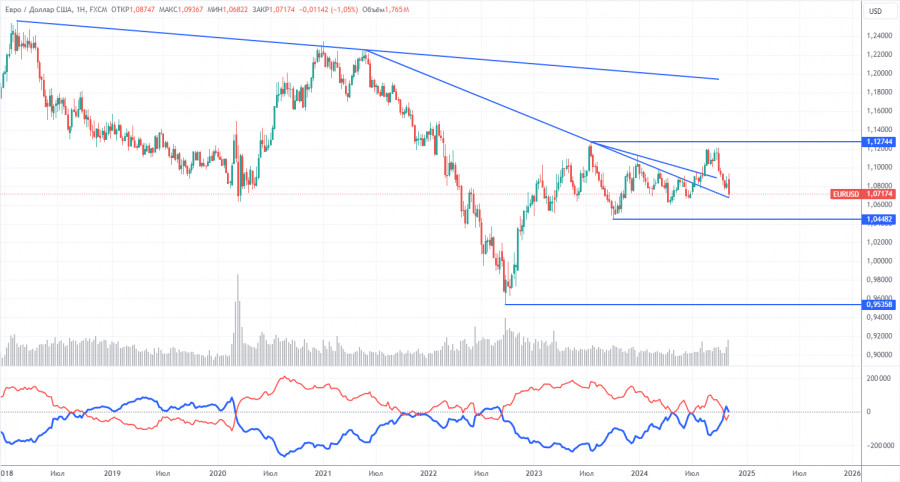
The latest Commitments of Traders (COT) report is dated November 5. The net position of non-commercial traders has long remained bullish, with bears failing to gain dominance. However, three weeks ago, professional traders significantly increased their short positions, turning the net position negative for the first time in a long while. This indicates that the euro is now being sold more frequently than bought.
We still see no fundamental factors supporting the euro's strength, while technical analysis indicates consolidation—a flat market. On the weekly time frame, the pair has been trading between 1.0448 and 1.1274 since December 2022, effectively transitioning from a 7-month to a 20-month range. A move toward 1.0448 remains more likely.
Currently, the red and blue lines have crossed and reversed positions. Over the last reporting week, the number of long positions in the non-commercial group increased by 600, while short positions decreased by 28,000, resulting in a net drop of 27,400. The euro still has strong potential for further declines.
EUR/USD 1-Hour Analysis
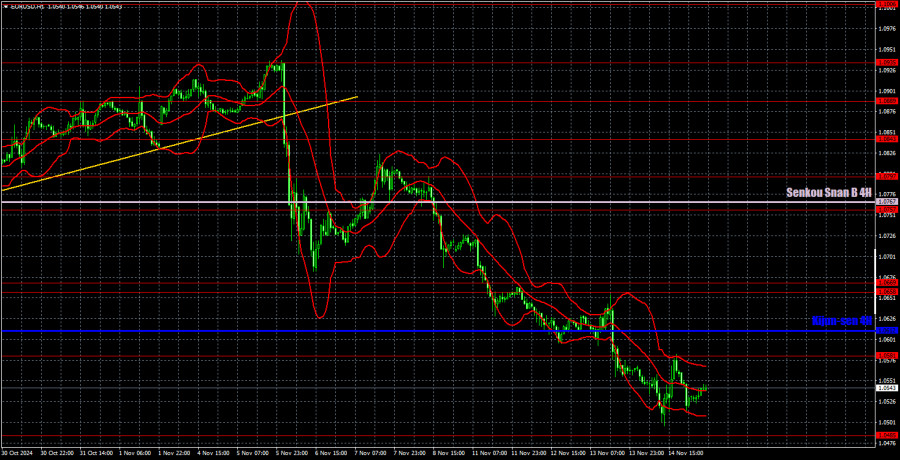
The pair continues to form a new downward trend on the hourly chart. Discussing the fundamental and macroeconomic rationale for the dollar's medium-term decline is pointless, as there are none. We expect nothing but a continuation of the euro's decline in the medium term. With each passing day, it becomes increasingly clear that the market has already fully priced in the Fed's monetary easing cycle. Meanwhile, the Fed shows no urgency in cutting rates, a move already accounted for.
For November 15, we highlight the following levels for trading: 1.0485, 1.0533, 1.0581, 1.0658–1.0669, 1.0757, 1.0797, 1.0843, 1.0889, 1.0935, 1.1006, as well as the Senkou Span B (1.0767) and Kijun-sen (1.0612) lines. The Ichimoku indicator lines may shift throughout the day, which should be considered when identifying trading signals. Don't forget to set a Stop Loss order to break even if the price moves 15 pips in the intended direction. This helps protect against potential losses if the signal turns out to be false.
On Friday, the Eurozone has no significant or interesting events scheduled, while the U.S. will release reports on retail sales and industrial production. We do not believe these reports can drastically change market sentiment, which remains firmly aligned with buying the U.S. dollar.
Chart Explanations:
Support and resistance levels: thick red lines around which movement may end. They are not sources of trading signals.
Kijun-sen and Senkou Span B lines: Ichimoku indicator lines transferred from the 4-hour to the 1-hour timeframe. These are strong lines.
Extreme levels: thin red lines where the price previously rebounded. They are sources of trading signals.
Yellow lines: Trend lines, trend channels, and other technical patterns.
Indicator 1 on COT charts: The net position size for each category of traders.


