empty
 
 
24.09.2024 05:33 PM
EUR/USD. September 24th. The European economy is slowing down
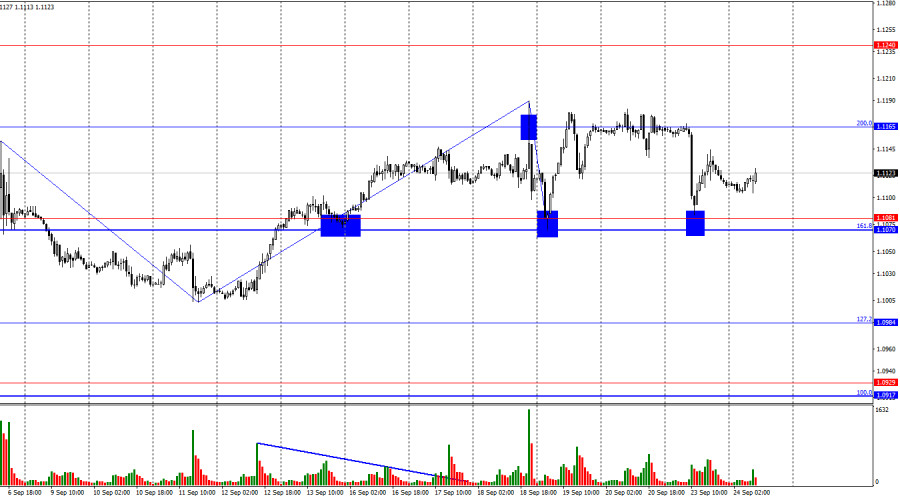
On Monday, the EUR/USD pair sharply fell to the support zone of 1.1070–1.1081, rebounded from it, and reversed in favor of the European currency. As a result, the upward movement might continue on Tuesday toward the 200.0% Fibonacci level at 1.1165. A close above 1.1165 would increase the likelihood of further growth toward the next level at 1.1240. The bullish trend remains intact.

This image is no longer relevant

The wave structure has become somewhat more complex but still doesn't raise any significant concerns. The last completed downward wave (September 18-19) did not break the low of the previous wave, while the last completed upward wave (September 11-18) broke the peak of the previous wave. Thus, the bearish trend is currently canceled, and the pair is either transitioning into a complex sideways range or starting to form a new bullish trend. A close below the support zone of 1.1070–1.1081 would invalidate the emerging bullish trend.

The information background on Monday was not particularly strong but was still interesting. The most notable data was the manufacturing and services PMI figures for the Eurozone. The manufacturing PMI declined from 42.4 to 40.3, indicating further deterioration. The services PMI decreased from 51.2 to 50.6 and is close to falling below 50.0, indicating a negative trend. Thus, business activity in the Eurozone continues to worsen despite the ECB's easing monetary policy. This decline in activity could cause a slowdown in the European economy. The Eurozone's GDP has shown maximum growth of just 0.3% over the past seven quarters. A slowdown could lead to a full-fledged recession by 2025. This is undoubtedly bad news for the euro, but traders currently seem to be ignoring it. The European currency continues to aim higher despite the evident problems in the Eurozone.

This image is no longer relevant

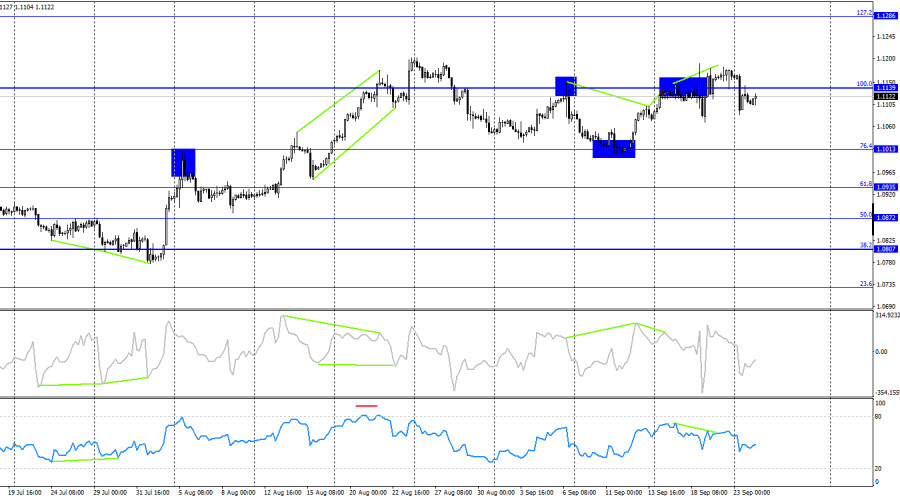
On the 4-hour chart, the pair reversed in favor of the US dollar following a series of bearish divergences in the RSI and CCI indicators. The RSI also entered the overbought zone a few weeks ago. The decline has begun, but given the strength of the bulls, a substantial drop in the euro seems unlikely at this point. A break below the 1.1139 level suggests a move toward 1.1013, but on the hourly chart, the bears have already encountered the first support level.

Commitments of Traders (COT) Report:

This image is no longer relevant

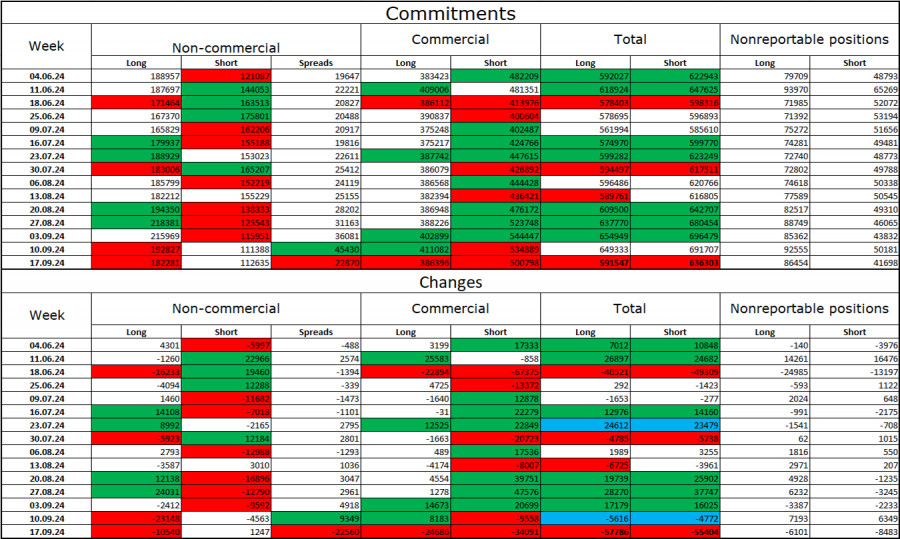
During the last reporting week, speculators closed 10,540 long positions and opened 1,247 short positions. The sentiment of the "Non-commercial" group turned bearish several months ago, yet bulls have started to dominate again. The total number of long positions held by speculators now stands at 182,000, compared to just 112,000 short positions.

However, for the second consecutive week, major players are offloading the euro. In my view, this could be a precursor to a new bearish trend or at least a correction. The primary factor for the dollar's decline – expectations of monetary policy easing by the FOMC – has already been priced in, and the dollar no longer has immediate reasons to weaken. New factors might emerge over time, but at the moment, the US dollar seems more likely to strengthen. Active selling of the euro hasn't started yet, but if it does, the chances of a bearish trend will increase.

News Calendar for the US and Eurozone:

  • Eurozone: Business Expectations Index in Germany (07:00 UTC)
  • Eurozone: Current Assessment in Germany (07:00 UTC)
  • Eurozone: IFO Business Climate Index in Germany (07:00 UTC)

On September 24, the economic calendar contains three entries, none of which are particularly significant. The influence of the news background on trader sentiment throughout the day is expected to be minimal.

EUR/USD Forecast and Trading Recommendations:

Selling opportunities for the pair were available upon a close below 1.1139 on the 4-hour chart, targeting 1.1081 and 1.0984. It's advisable to move the stop-loss for this trade to the breakeven level. Long positions could have been considered on a rebound from the 1.1070–1.1081 support zone on the hourly chart with a target of 1.1139, but caution is advised with any buying positions at this stage.

The Fibonacci levels are drawn from 1.0917 to 1.0668 on the hourly chart and from 1.1139 to 1.0603 on the 4-hour chart.

Samir Klishi,
Analytical expert of InstaForex
© 2007-2024
Earn on cryptocurrency rate changes with InstaForex
Download MetaTrader 4 and open your first trade
  • Grand Choice
    Contest by
    InstaForex
    InstaForex always strives to help you
    fulfill your biggest dreams.
    JOIN CONTEST
  • Chancy Deposit
    Deposit your account with $3,000 and get $3000 more!
    In September we raffle $3000 within the Chancy Deposit campaign!
    Get a chance to win by depositing $3,000 to a trading account. Having fulfilled this condition, you become a campaign participant.
    JOIN CONTEST
  • Trade Wise, Win Device
    Top up your account with at least $500, sign up for the contest, and get a chance to win mobile devices.
    JOIN CONTEST
  • 100% Bonus
    Your unique opportunity to get a 100% bonus on your deposit
    GET BONUS
  • 55% Bonus
    Apply for a 55% bonus on your every deposit
    GET BONUS
  • 30% Bonus
    Receive a 30% bonus every time you top up your account
    GET BONUS

Recommended Stories

Can't speak right now?
Ask your question in the chat.
Widget callback