The EUR/USD pair traded higher during the first half of Wednesday. However, it would be helpful to look at not just yesterday but two days at once - Tuesday and Wednesday. These two days vividly illustrate what is currently happening in the market regarding the U.S. dollar.
So, let's start with Tuesday. On that day, the U.S. Producer Price Index (PPI) was released, coming in 0.1% below forecasts at 2.2% year-on-year for July. Meanwhile, the June figure was revised up by 0.1%. Following this report, the U.S. dollar depreciated against the euro by about 60 pips, which is significant given the current volatility. The market did not even wait for yesterday's inflation report to resume selling the U.S. dollar.
On Wednesday morning, reports on GDP and industrial production for the Eurozone were published. The second estimate of GDP for Q2 was unchanged from the first estimate, while industrial production was, as usual, below forecasts. Nevertheless, the euro continued to rise from the start of the day. One might explain the further fall of the dollar in various ways, but these explanations seem lacking in logic. It is unlikely that mediocre, if not worse, European data triggered the euro's rise. So what then? The only answer is the same U.S. PPI index, which deviated from the forecast by only 0.1% and caused a general decline in the dollar by 100 pips. And that's all there is to know about how the market is currently trading the U.S. dollar.
Any report, even the most ordinary one, can be interpreted by the market as a strong signal to sell the dollar. The market believes that the Federal Reserve will cut the key rate by 0.5% in September and lower it by another 0.75% by the end of the year. Whether it materializes or not is irrelevant. For instance, yesterday's inflation report showed a slowdown to 2.9% in July. What's intriguing is not the indicator's value but the fact that official forecasts were raised just before the report's release from 2.9% to 3.0%. In other words, while experts predicted a drop in U.S. inflation to 2.9% on Tuesday, this was no longer the case by Wednesday. As a result, the actual value was below forecasts, and surprisingly, the dollar did not lose another 100 pips on this report.
The market is currently in absolute chaos, directed solely at depreciating the U.S. dollar. We have already mentioned that under the current circumstances, the dollar can continue to fall for as long as it wants. There is no logic in the current movements of the EUR/USD pair. Just think about it: the European Central Bank's rate is 1.25% lower than the Fed's rate, and the ECB is currently implementing monetary policy easing. Yet the dollar is falling. One can speculate endlessly about weak macroeconomic data in the U.S., but the fact remains: the dollar is declining on practically any news.

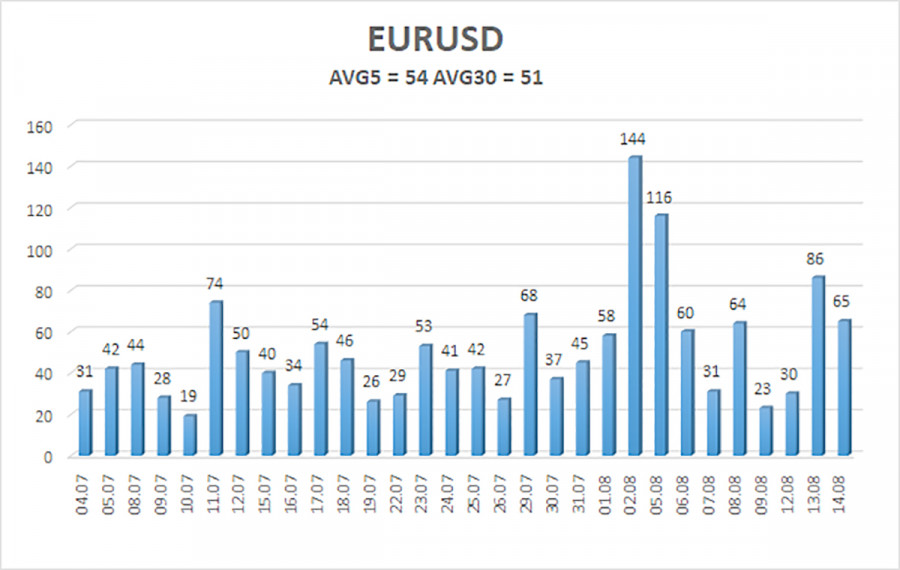
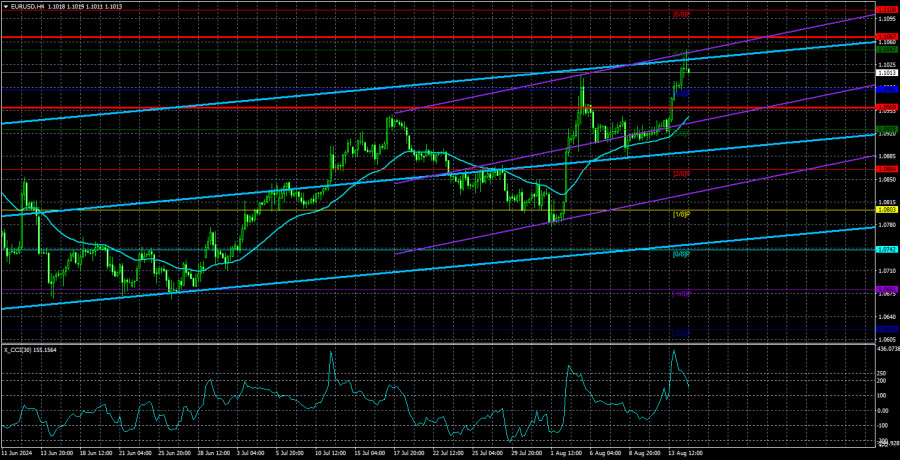
The average volatility of EUR/USD over the past five trading days as of August 15 is 54 pips, which is considered low. We expect the pair to move between the levels of 1.0959 and 1.1067 on Thursday. The upper channel of the linear regression is directed upwards, but the global downtrend remains intact. The CCI indicator entered the overbought area for the third time, which warns not only of a possible trend reversal to the downside but also of how the current uptrend is entirely illogical.
Nearest Support Levels:
- S1 – 1.0986
- S2 – 1.0925
- S3 – 1.0864
Nearest Resistance Levels:
- R1 – 1.1047
- R2 – 1.1108
- R3 – 1.1169
We recommend checking out other articles by the author:
Review of GBP/USD on August 15; The US Producer Price Index is more important than inflation in Britain
Trading Recommendations:
The EUR/USD pair maintains a global downward trend, but in the 4-hour time frame, the upward movement has resumed, thanks to a new series of disappointing reports from the U.S. In previous reviews, we mentioned that we only expect declines from the euro. We believe the euro cannot start a new global trend amid the ECB's monetary policy easing, so the pair will likely fluctuate between 1.0600 and 1.1000 for some time. However, it is currently foolish to deny that the price is moving upward, and there are no signs of its end yet.
Explanations for Illustrations:
Linear Regression Channels: help determine the current trend. If both are directed in the same direction, it means the trend is strong.
Moving Average Line (settings 20,0, smoothed): determines the short-term trend and the direction in which trading should be conducted.
Murray Levels: target levels for movements and corrections.
Volatility Levels (red lines): the probable price channel in which the pair will spend the next 24 hours, based on current volatility indicators.
CCI Indicator: Entering the oversold area (below 250) or the overbought area (above +250) means a trend reversal is approaching.


