The GBP/USD currency pair retreated from the highs of the previous day on Thursday. Yesterday, we mentioned that conclusions should not be drawn immediately after the FOMC meeting. Especially when the Bank of England meeting is scheduled for the next day. As a result, we saw a sharp rise in the British currency, which was followed by a decline the next day. And the decline is more than justified, and even very weak compared to the fundamental background that was present on Wednesday and Thursday. Let's start dissecting this.
First, the results of the FOMC meeting cannot be called "dovish." The fact that the market once again interpreted the "neutral" or "moderately hawkish" results against the dollar is a separate topic for discussion, which we regularly cover. However, according to the information provided by the Fed, the dollar on Wednesday evening was more likely to strengthen its position than to fall again.
Second, the results of the Bank of England meeting should be considered "moderately dovish." The key rate remained unchanged, but the voting pattern among central bank officials regarding the rate shifted to a more "dovish" side. If, at the January meeting, two officials voted for a rate hike, then at the March meeting, none did. One vote was cast in favor of a rate cut, and eight members of the monetary committee voted to keep the rate at the current level. Accordingly, the stance of the British regulator became softer. The British pound fell after this information hit the market, but it fell much less than it rose the day before. Therefore, we once again conclude about a similar rise in the GBP/USD pair, which fortunately quickly ended.
As before, the current fundamental and macroeconomic background implies only a decline in the British currency. And the market, as before, completely refuses to sell the pound and buy the dollar. Now that both meetings are behind us, the decline in the British currency should resume. Inflation in the UK is decreasing even faster than expected by the market and experts. The Bank of England is gradually moving away from a "hawkish" monetary policy. The UK economy has already entered a recession, so the central bank needs to start thinking about rate cuts rather than keeping them.
The fact that the Fed still needs to change its stance regarding the timing of monetary policy easing is neither good nor bad for the dollar. It's just a fact. June remains the most likely time for the Fed to cut rates for the first time. However, inflation may continue to present unpleasant surprises for the Fed. In this case, June could smoothly turn into July and then into September. In the UK, with the current pace of inflation slowdown, rate cuts may occur even earlier than in the US. All the information presented above should only support the American currency.

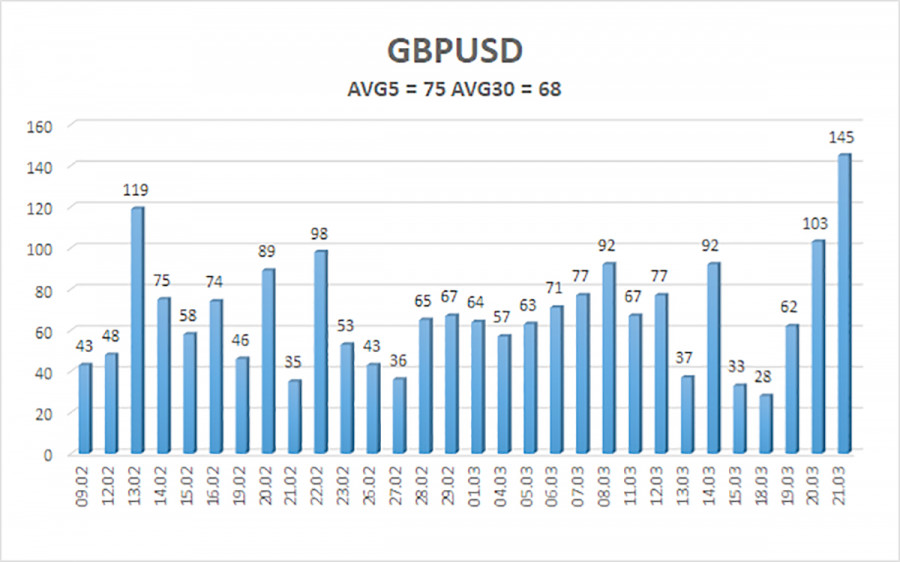
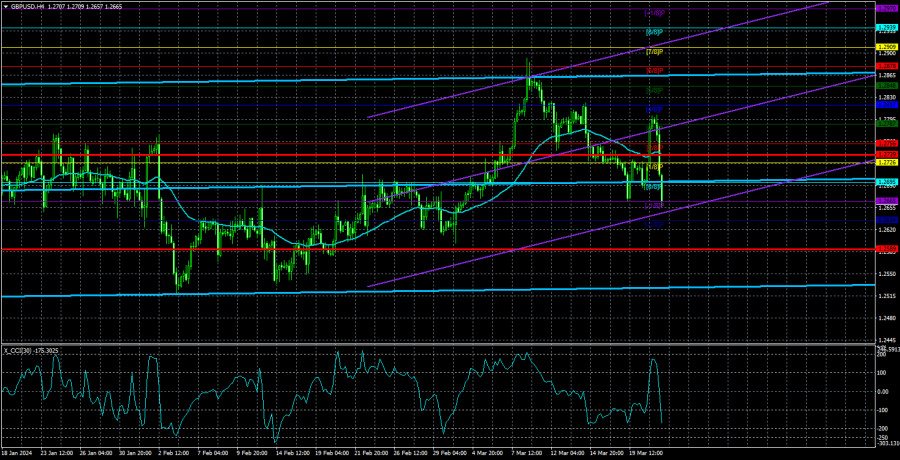
The average volatility of the GBP/USD pair over the last 5 trading days is 75 points. For the pound/dollar pair, this value is considered "average." Therefore, on Friday, March 22, we expect movement within the range limited by the levels of 1.2589 and 1.2739. The senior linear regression channel remains sideways, so there are no questions about the current trend. The CCI indicator has not entered the oversold zone recently, nor has it entered the overbought zone. The market is currently trading somewhat illogically, but traders are entitled to expect a new significant downward movement.
The nearest support levels:
S1 – 1.2665
S2 – 1.2634
The nearest resistance levels:
R1 – 1.2695
R2 – 1.2756
R3 – 1.2787
Trading recommendations:
The GBP/USD currency pair broke out of the flat and attempted to resume the upward trend. But we still expect the movement to continue to the south, with targets at 1.2543 and 1.2512. The market still extremely reluctantly buys the dollar and sells the pound, often ignoring the fundamental and macroeconomic background. Formally, long positions can be considered when the price is above the moving average, but we only support selling the pair. Today, the market reconsidered the results of the FOMC meeting in favor of the dollar, and the Bank of England meeting crushed the British currency on Thursday.
Explanations for illustrations:
Linear regression channels – help determine the current trend. If both are directed in the same direction, it means the trend is strong right now.
The moving average line (settings 20.0, smoothed) – determines the short-term trend and the direction in which trading should be conducted.
Murray levels – target levels for movements and corrections.
Volatility levels (red lines) – the probable price channel in which the pair will spend the next day, based on current volatility indicators.
CCI indicator – its entry into the oversold area (below -250) or the overbought area (above +250) indicates that a trend reversal towards the opposite direction is approaching.


