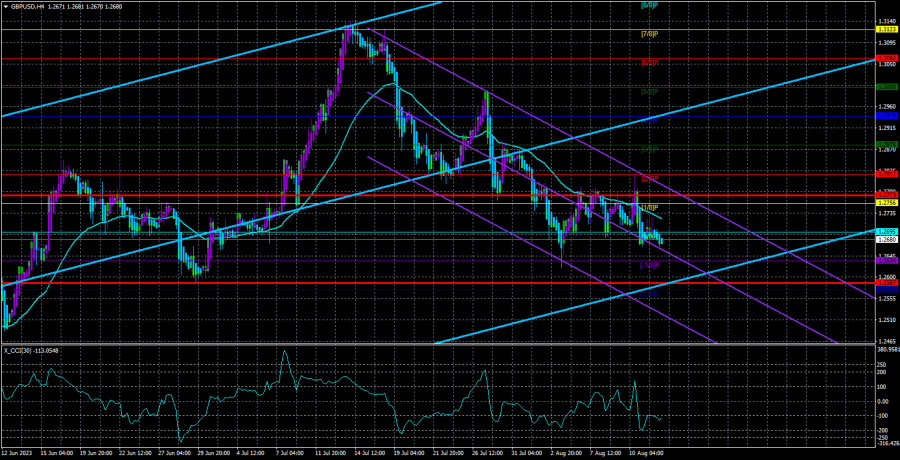
On Friday, the GBP/USD currency pair continued sluggishly declining, remaining within a range resembling a sideways channel. And in the UK, the first statistics for the entire week were published, initially supporting the pound and later favoring the US dollar. Thus, by the end of the day, the pound hadn't lost much, but at the same time, it failed to adjust properly within the downward trend of recent weeks. It couldn't secure a position above its moving average, and the fundamental and macroeconomic backgrounds have long ceased to support the pair's growth.
Since the beginning of this year, we've consistently stated that the pound is overbought and unjustifiably expensive, anticipating a significant drop in it. The market held a different view. We want to remind everyone once again that major players can make trades that aren't necessarily aimed at profit-making. For instance, they might buy billions of dollars of one currency or another simply because they need it for transactions with international partners. Therefore, even if fundamentals and macroeconomics indicate a particular direction, it doesn't mean the pair will move in that direction. This has been evident over the past six months.
However, every "fairy tale" ends sooner or later. The Bank of England might raise the rate a few more times, but the market should have already factored in these potential hikes multiple times, considering the pound's rise of almost 3000 points over the past 11 months. The fact that the Federal Reserve has also been raising rates during this period has been long forgotten by the market.
Important reports unlikely to help the pound
There are a few things to look out for this week in the UK. Data on unemployment rates, wages, and unemployment benefit claims will be released on Tuesday. The first two reports are unlikely significant and won't provoke a strong market reaction. The last report could trigger a significant reaction if its value deviates significantly from the forecast, as seen in recent months. On Wednesday, an equally important inflation report will be published. It's expected that by the end of July, the Consumer Price Index will slow down to 6.8%, which is still high and won't allow the Bank of England to take a pause or contemplate ending tightening measures. But every slowdown in inflation brings the regulator closer to this point. This means the market has fewer reasons to buy British currency.
Retail sales data will come out on Friday, but this is a secondary report. And in the States? The US will have the same retail sales on Tuesday, industrial production and new home sales on Wednesday, and unemployment benefit claims on Thursday. These reports have an extremely low chance of drastically affecting the pair's movement, let alone changing the market's mood. The pair's general trend (downward) will remain the same this week.
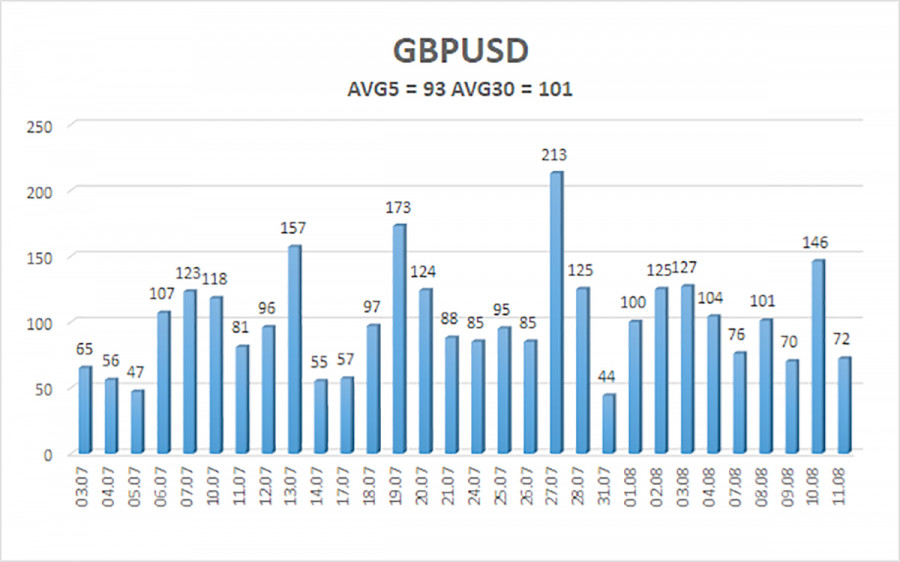
The average volatility of the GBP/USD pair for the last five trading days is 93 points. For the pound/dollar pair, this value is considered "average." On Monday, August 14th, we anticipate movement within a range bounded by levels 1.2587 and 1.2773. A reversal of the Heiken Ashi indicator upwards would signal the start of a new upward trend within the sideways channel.
Nearest support levels:
Nearest resistance levels:
- R1 – 1.2695
- R2 – 1.2756
- R3 – 1.2817
Trading recommendations:
In the 4-hour timeframe, the GBP/USD pair remains below the moving average. Short positions targeting 1.2634 and 1.2581 are relevant and should be kept open until the Heiken Ashi indicator turns upwards. Long positions can be considered if the price secures above the moving average with targets at 1.2773 and 1.2817. Additionally, a continuation of the flat trend is possible now.
Illustration explanations:
- Linear regression channels help identify the current trend. If both are directed in the same direction, the trend is strong.
- Moving average line (settings 20.0, smoothed) determines the short-term tendency and the direction in which trading should be conducted.
- Murray levels are target levels for movements and corrections.
- Volatility levels (red lines) represent the likely price channel within which the pair will operate for the upcoming day based on current volatility indicators.
- CCI indicator entering the oversold area (below -250) or the overbought area (above +250) indicates an approaching trend reversal in the opposite direction.


