Analysis of EUR/USD 5M.
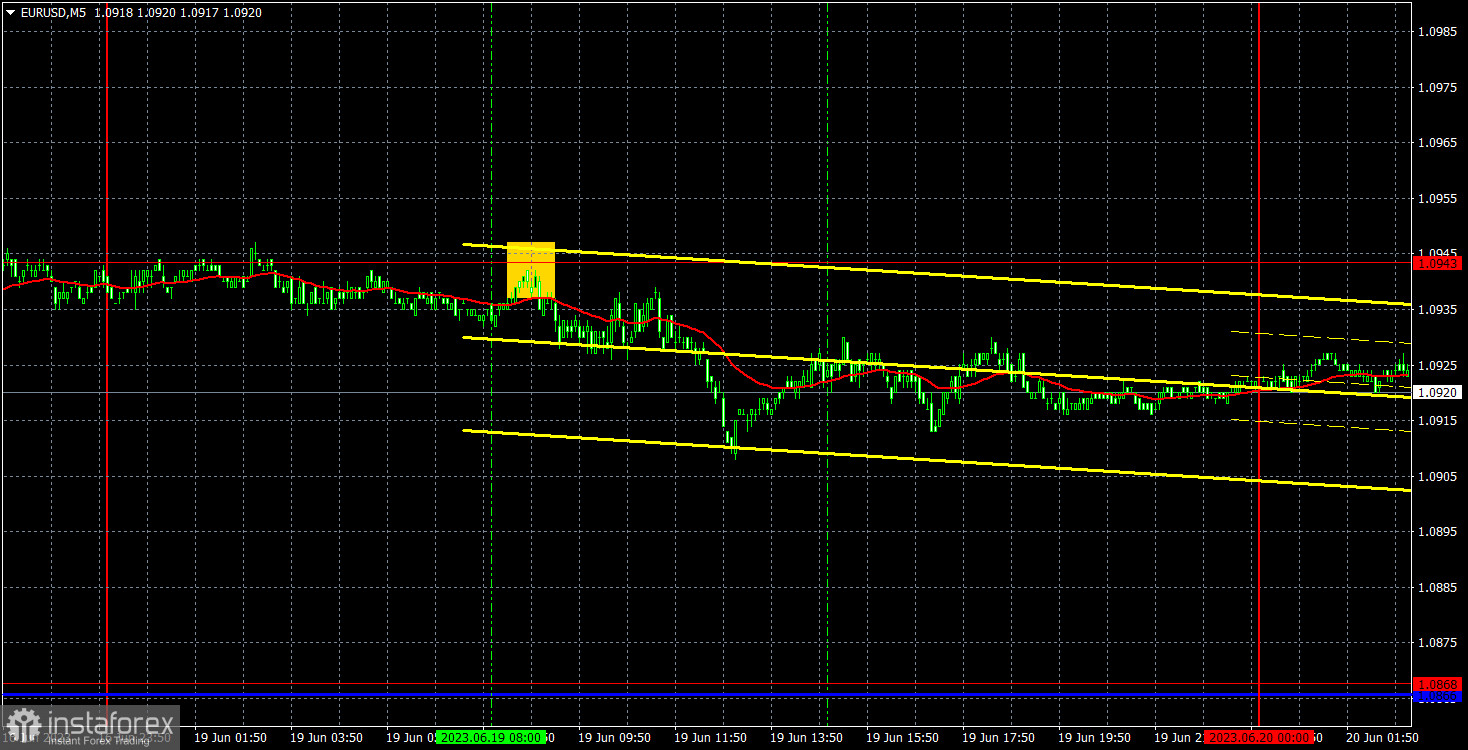
The EUR/USD pair remained unchanged on Monday. This is hardly surprising given that there were no crucial events or news releases yesterday. Volatility was less than 40 pips. It was quite difficult to trade in such a market. ECB policymakers Luis de Guindos, Isabelle Schnabel, and Philip R. Lane made speeches. However, they did not tell the market anything new because last week the monetary policy meeting took place. Investors have already received all the necessary information.
There was only one entry point. At the very beginning of the European session, a rebound occurred near 1.0943. Traders had a chance to go short as at that time it was not yet clear that the pair would show very weak, sideways movements. The pair declined by about 15-20 pips. Speculators could have made a profit by closing the position manually at almost any time. There were no other signals during the day.
COT report:
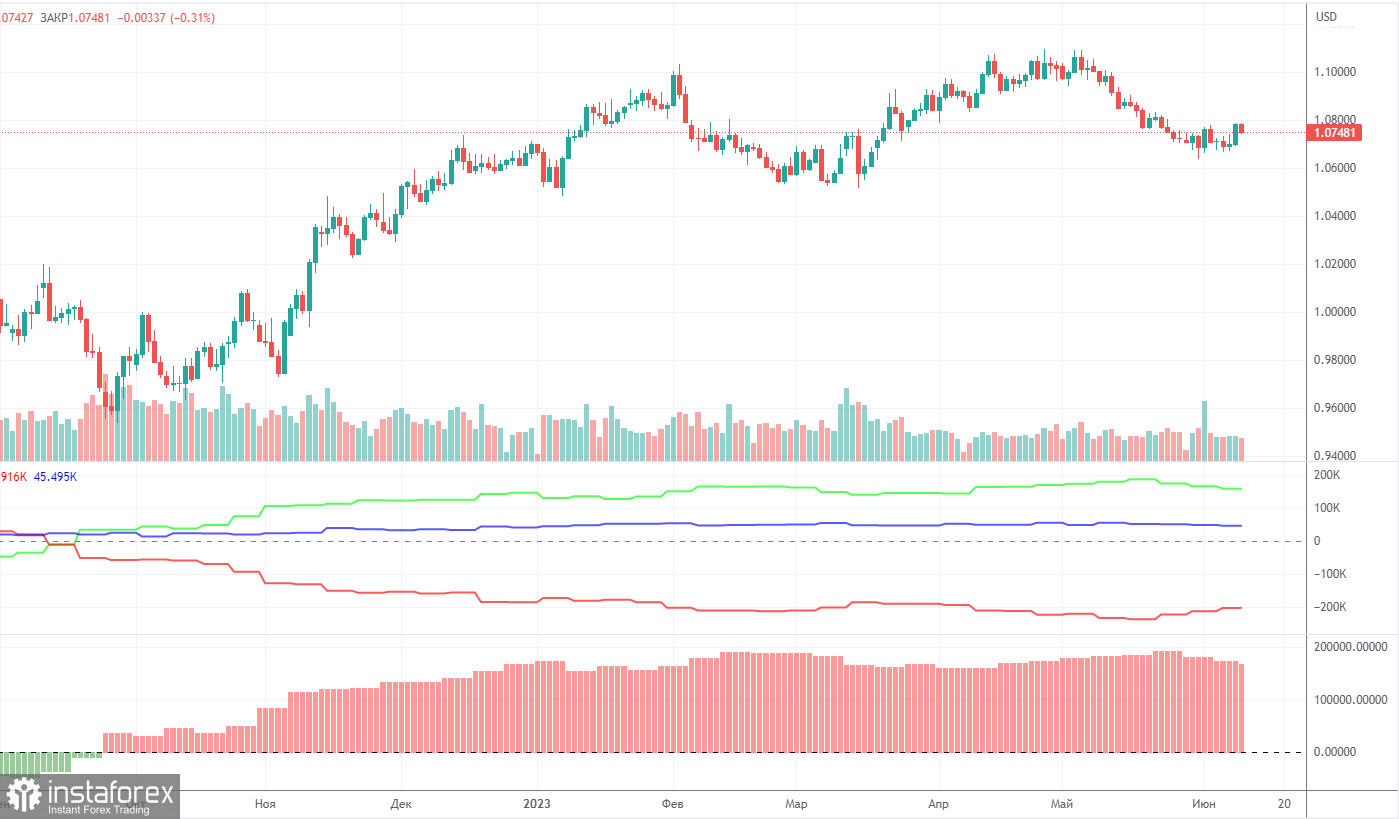
The last COT report was released on June 6. In the last 9 months, COT reports have fully corresponded to what is happening on the market. The chart above clearly shows that the net position of big traders (the second indicator) began to grow again in September 2022. At the same time, the euro resumed an upward movement. The net position of non-commercial traders is bullish. The euro is trading at its highs against the US dollar.
I have already mentioned that a fairly high value of the "net position" indicates the end of the uptrend. The first indicator also signals such a possibility as the red and green lines are very far from each other. It often occurs before the end of the trend. The euro tried to start falling a few months ago but there was only a pullback. During the last reporting week, the number of long positions of the "Non-commercial" group of traders decreased by 5,700 and the number of short positions rose by 1,500. The number of long positions is higher than the number of short ones. This is a very large gap. The number of long positions is 59,000 higher than short ones. The difference is more than three times. The correction has begun. Yet, it may not be a correction but the start of a new downtrend. At this time, it is clear that the pair is likely to resume a downward movement without COT reports.
Analysis of EUR/USD 1H.
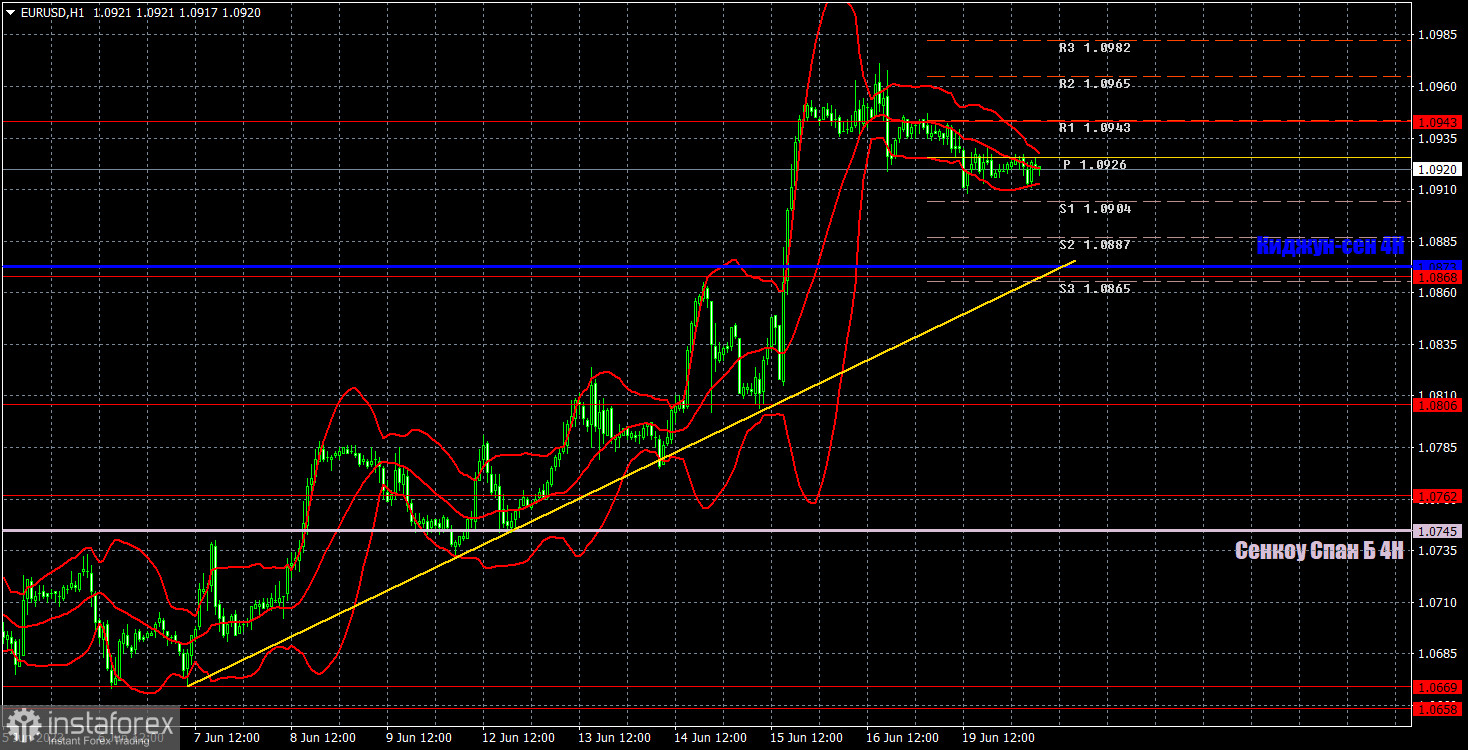
On the 1H, the pair is trying to start an uptrend but there are no drivers for growth. Last week, there were many events that bolstered its rise. However, in the medium term, there are still no reasons to go long. Technical indicators signal an uptrend. It would be better not to sell the pair now. We need to wait at least for consolidation below the trend line and the target level.
On June 20, one should pay attention to the following levels: 1.0581, 1.0658-1.0669, 1.0762, 1.0806, 1.0868, 1.0943, 1.1092, 1.1137, as well as the Senkou Span B (1.0745) and Kijun-sen (1.0873) lines. The lines of the Ichimoku indicator can move during the day. Bear it in mind when determining trading signals. There are also support and resistance levels but they do not provide signals, e.g. bounces or breakouts from extreme levels and lines. Do not forget about placing a Stop Loss order at breakeven if the price moves in the right direction by 15 pips. It will you avoid losses if the signal turns out to be false.
Several ECB and Fed policymakers are scheduled to deliver speeches today. However, traders are likely to ignore their statements. The Fed held a meeting last week. So, traders will hardly get new clues about future steps on monetary policy. The US will also unveil building permits data.
What's on charts:
Support and resistance levels (resistance /support) are thick red lines near which the trend may end. They do not provide trading signals.
The Kijun-sen and Senkou Span B lines are the lines of the Ichimoku indicator plotted to the H1 chart from the 4H one. They are strong lines.
Extreme levels are thin red lines from which the price bounced earlier. They provide trading signals.
Yellow lines are trend lines, trend channels, and any other technical patterns.
Indicator 1 on the COT charts is the net position size of each category of traders.
Indicator 2 on the COT charts is the net position size for the "Non-commercial" group of traders.