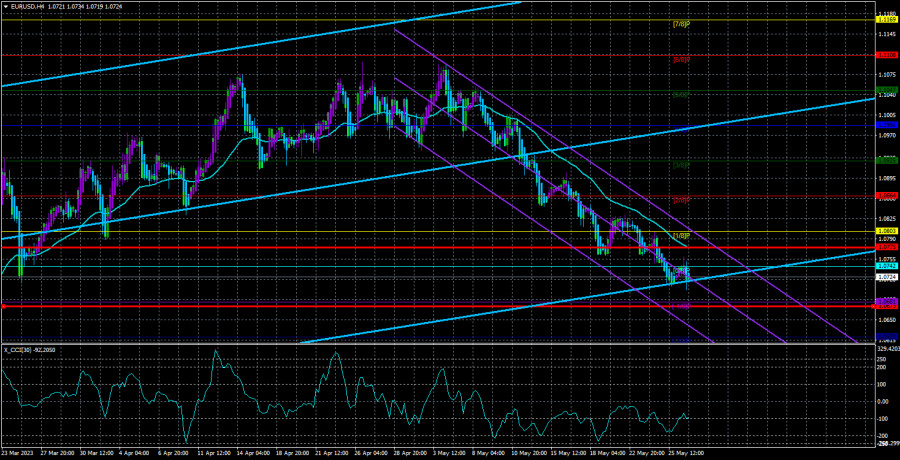
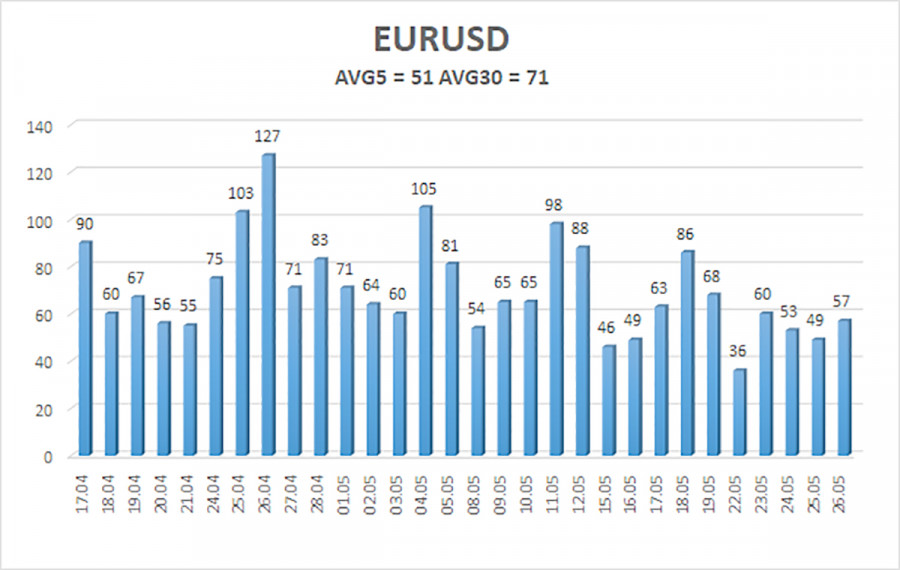
The EUR/USD currency pair continued to trade with weak volatility and a downward bias on Friday. At present, the market is in a somewhat paradoxical situation. There is a clear and strong downward trend, but the pair moves within 50-60 points per day, decreasing by approximately 20 pips daily. On the one hand, we have a strong trend; on the other hand, there are weak intraday price fluctuations. Therefore, trading intraday at the moment could be more practical and effective.
As previously mentioned, the downward movement of the pair should continue in the medium term, regardless of the fundamental and macroeconomic background. There will be significant events next week, which could cause volatility in the pair. However, we doubt that even inflation reports in the Eurozone and US labor market data, including unemployment, will be impactful enough to turn the market around 180 degrees. European inflation will likely continue declining, and the US labor market is unlikely to show discouraging results. Thus, the situation in the currency market will remain unchanged after the new week. We may witness an upward correction since fundamental reasons are unnecessary for technical corrections. However, in the medium term, we continue to expect a stronger strengthening of the US dollar.
As we have already mentioned, there have been a significant number of speeches by representatives of the ECB and the Federal Reserve (FRS) in the past two weeks. One of them was an interview with Bostjan Vasle. He stated on Friday that the ECB should continue to raise the key interest rate to bring inflation down to the target level of 2%. Mr. Vasle also mentioned that further steps to tighten monetary policy would be less aggressive than in the past. According to him, the central bank is approaching a level of interest rates that will be sufficiently restrictive to bring inflation back to 2%. Despite Mr. Vasle's hawkish comments, the European currency did not react with growth. From our point of view, this is not surprising. The market has most likely priced all the remaining interest rate hikes in advance.
Thus, the market, including ourselves, expects two more 0.25% rate hikes from the ECB. If these expectations are met, the euro currency will soon have no grounds for growth. Of course, this does not mean that the euro will only decline from now on. Sooner or later, the downward movement will end, and at least corrective growth will begin. Predicting the fundamental background in 3-6 months is also difficult. Central banks may start hinting at easing monetary policy by the end of the year. Alternatively, suppose inflation slows down to the extent that the market expects a rate cut soon. In that case, the market will anticipate and react to these future changes in monetary policy. Therefore, speculating what might happen in six months is less meaningful.
There are currently no technical barriers to the pair's decline. It is very good and important that the pair has settled below the Ichimoku cloud in the 24-hour time frame, which means it can continue its downward movement up to the levels from where the growth started. That is another 200-250 points. Considering the pair's strong overbought condition, practically all factors now point to further depreciation of the European currency.
The average volatility of the euro/dollar currency pair over the past five trading days, as of May 29, is 51 points, characterized as "average." Therefore, we expect the pair to move between the levels of 1.0673 and 1.0775 on Monday. A reversal of the Heiken Ashi indicator upwards will indicate a new phase of the corrective movement.
Nearest support levels:
S1 - 1.0681
S2 - 1.0620
Nearest resistance levels:
R1 - 1.0742
R2 - 1.0803
R3 - 1.0863
Trading recommendations:
The EUR/USD pair continues its downward movement. It is advisable to remain in short positions with targets at 1.0681 and 1.0673 until the price consolidates above the moving average. Long positions will become relevant only after the price is established above the moving average line with a target of 1.0864.
Explanations for the illustrations:
Linear regression channels - help determine the current trend. If both channels point in the same direction, it indicates a strong trend.
Moving average line (settings 20,0, smoothed) - determines the short-term trend and direction for trading.
Murray levels - target levels for movements and corrections.
Volatility levels (red lines) - the probable price channel in which the pair is expected to move in the next 24 hours based on current volatility indicators.
CCI indicator - its entry into the oversold zone (below -250) or overbought zone (above +250) indicates an upcoming trend reversal in the opposite direction.


