signal strength 2 of 5
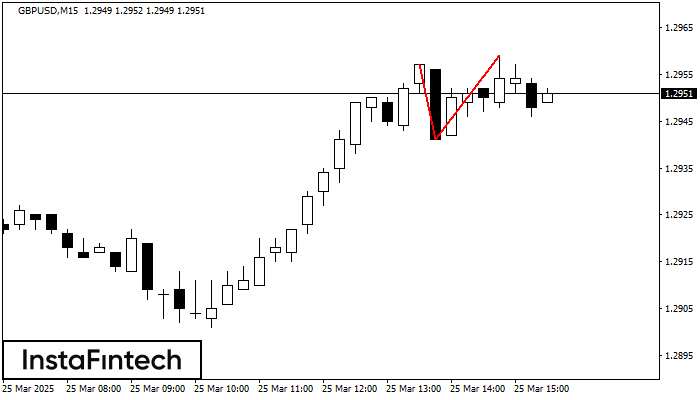
The Double Top reversal pattern has been formed on GBPUSD M15. Characteristics: the upper boundary 1.2957; the lower boundary 1.2941; the width of the pattern is 18 points. Sell trades are better to be opened below the lower boundary 1.2941 with a possible movements towards the 1.2918 level.
The M5 and M15 time frames may have more false entry points.
- All
- Double Top
- Flag
- Head and Shoulders
- Pennant
- Rectangle
- Triangle
- Triple top
- All
- #AAPL
- #AMZN
- #Bitcoin
- #EBAY
- #FB
- #GOOG
- #INTC
- #KO
- #MA
- #MCD
- #MSFT
- #NTDOY
- #PEP
- #TSLA
- #TWTR
- AUDCAD
- AUDCHF
- AUDJPY
- AUDUSD
- EURCAD
- EURCHF
- EURGBP
- EURJPY
- EURNZD
- EURRUB
- EURUSD
- GBPAUD
- GBPCHF
- GBPJPY
- GBPUSD
- GOLD
- NZDCAD
- NZDCHF
- NZDJPY
- NZDUSD
- SILVER
- USDCAD
- USDCHF
- USDJPY
- USDRUB
- All
- M5
- M15
- M30
- H1
- D1
- All
- Buy
- Sale
- All
- 1
- 2
- 3
- 4
- 5
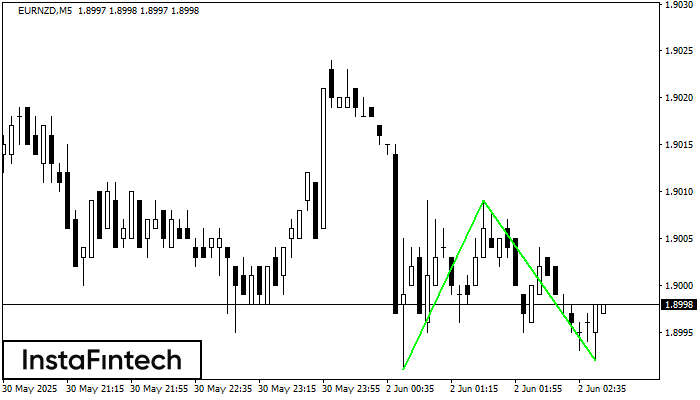
The Double Bottom pattern has been formed on EURNZD M5. This formation signals a reversal of the trend from downwards to upwards. The signal is that a buy trade should
The M5 and M15 time frames may have more false entry points.
Open chart in a new window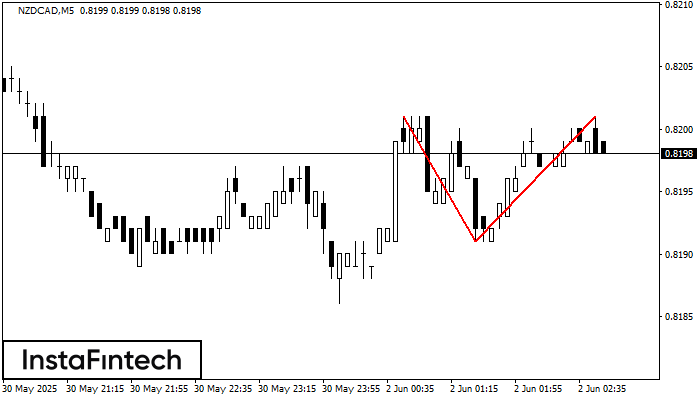
The Double Top pattern has been formed on NZDCAD M5. It signals that the trend has been changed from upwards to downwards. Probably, if the base of the pattern 0.8191
The M5 and M15 time frames may have more false entry points.
Open chart in a new window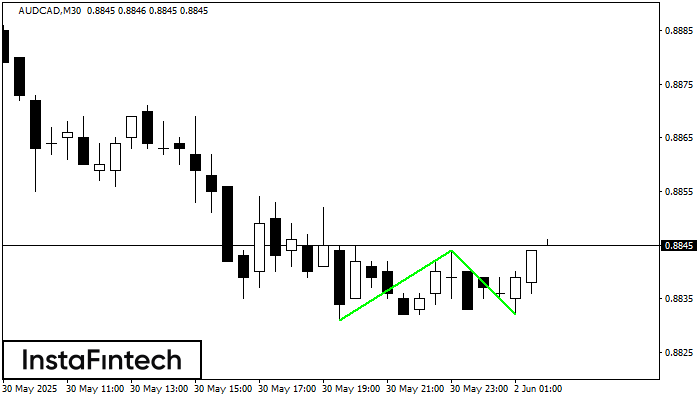
The Double Bottom pattern has been formed on AUDCAD M30. Characteristics: the support level 0.8831; the resistance level 0.8844; the width of the pattern 13 points. If the resistance level
Open chart in a new window