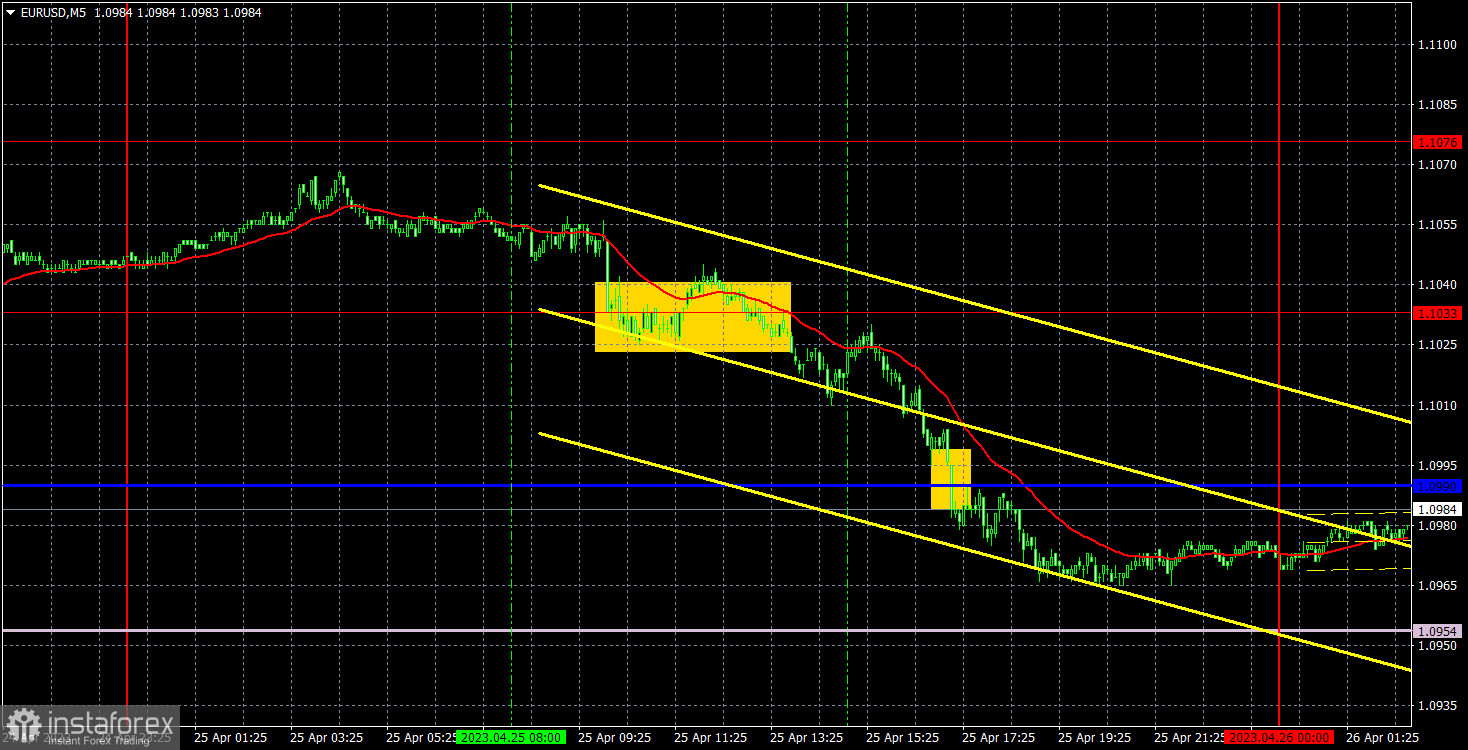
Analysis of EUR/USD 5M.
The EUR/USD pair unexpectedly fell on Tuesday. On Monday, the European currency rose sharply. Many analysts pointed out that that growth was not justified. Some investors might think that the euro resumed the uptrend. However, on Tuesday, the situation changed as if traders did not understand what to do with the pair. There are no reasons for going long but they also do not want to sell it as the uptrend persists. Additionally, there are no drivers now. Yesterday, traders only studied the speech of ECB's chief economist Philip R. Lane. His speech was neutral. Mr. Lane did not say anything new. Therefore, a fall in the pair looks logical based on the technical analysis but unexpected when it comes to the fundamental one. The euro has been growing for a month and a half, which should be followed by a downtrend. It may be even sharper than the upward movement.
Yesterday, trading signals were not clear but there was an opportunity to earn a profit. At first, there was a controversial breakout of 1.1033. Traders opened short positions. After that, the pair dropped below the critical line. However, it failed to reach the Senkou Span B line. Therefore, investors closed short positions manually in the late afternoon. The profit was about 50 pips.
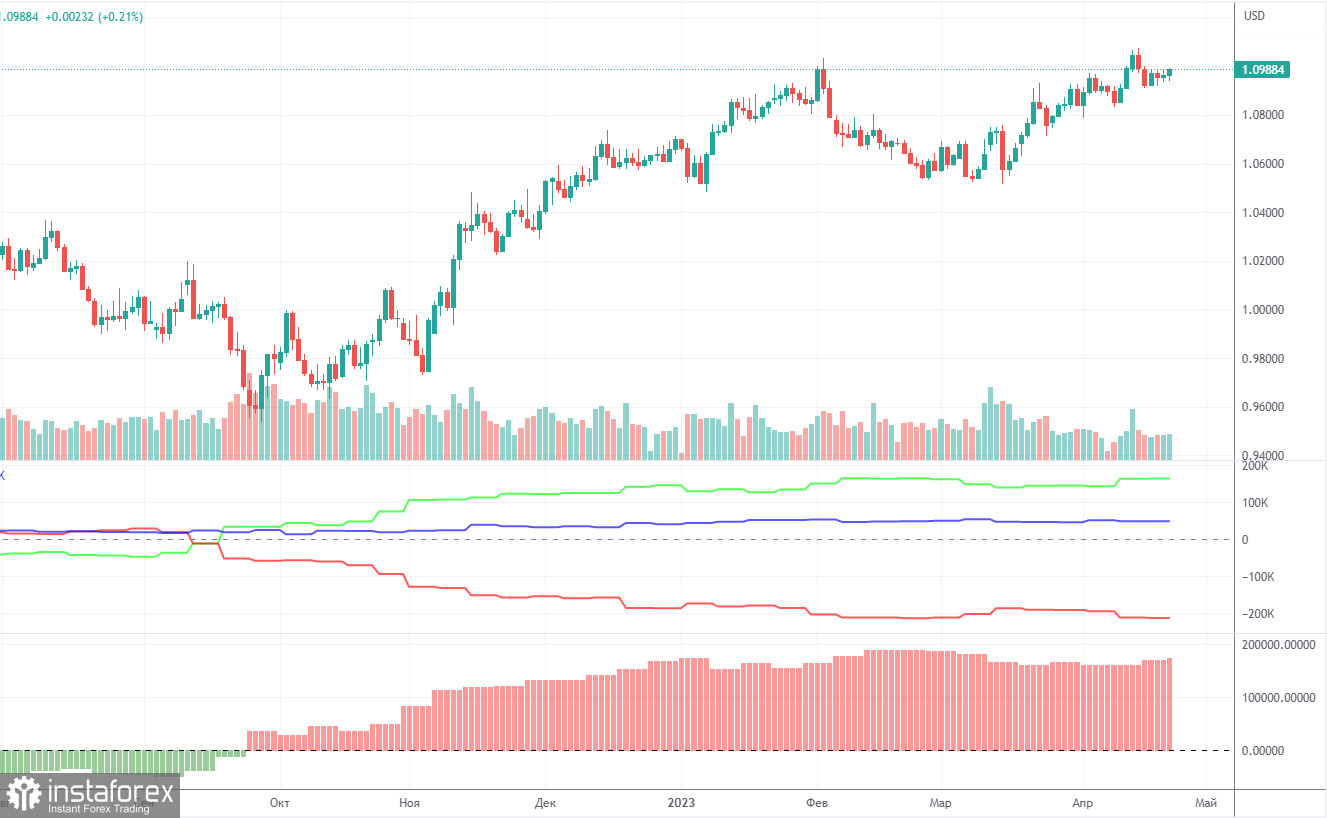
COT report:
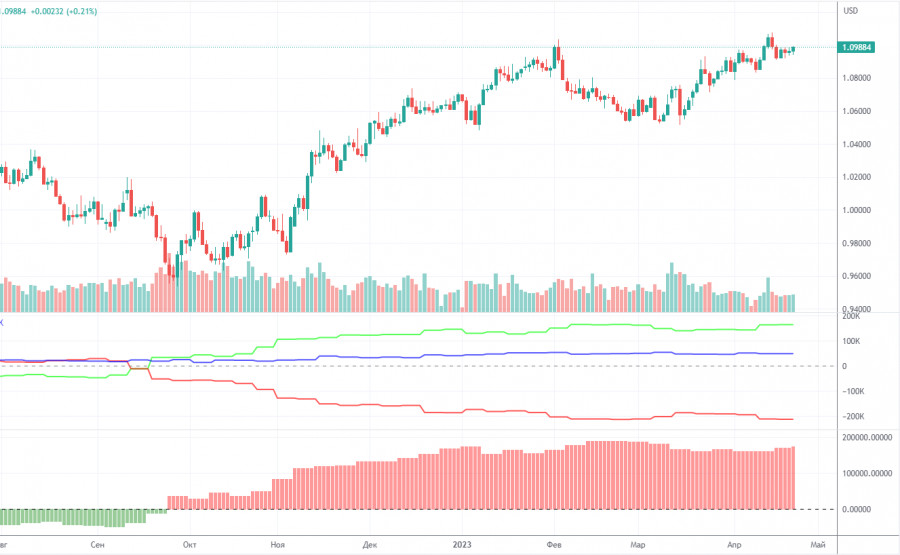
On Friday, the COT report for April 18 was released. In the last 7-8 months, the COT reports perfectly reflect what is happening in the market. The illustration above clearly shows that the net position of big traders (the second indicator) began to grow in September 2022. At about the same time, the euro resumed an upward movement. Now, the net position of non-commercial traders is bullish and remains very high. Hence, the euro keeps rising. It is unable to start a downward correction. Note that a high value of the net position signals the end of the uptrend. What is more, the first indicator also points to such a scenario. The red and green lines are located far away from each other, which often precedes the end of the trend. The European currency started dropping but rebounded. So, it looked like a pullback. During the last reporting week, the number of long positions of the non-commercial traders decreased by 1,800 and the number of short ones declined by 2.800. The net position has not changed markedly. The number of long positions is 164,000 higher than the number of short ones. The correction is unlikely to begin in the near future. Even without COT reports, it is clear that the pair may start a downtrend. However, now, it is gradually rising higher.
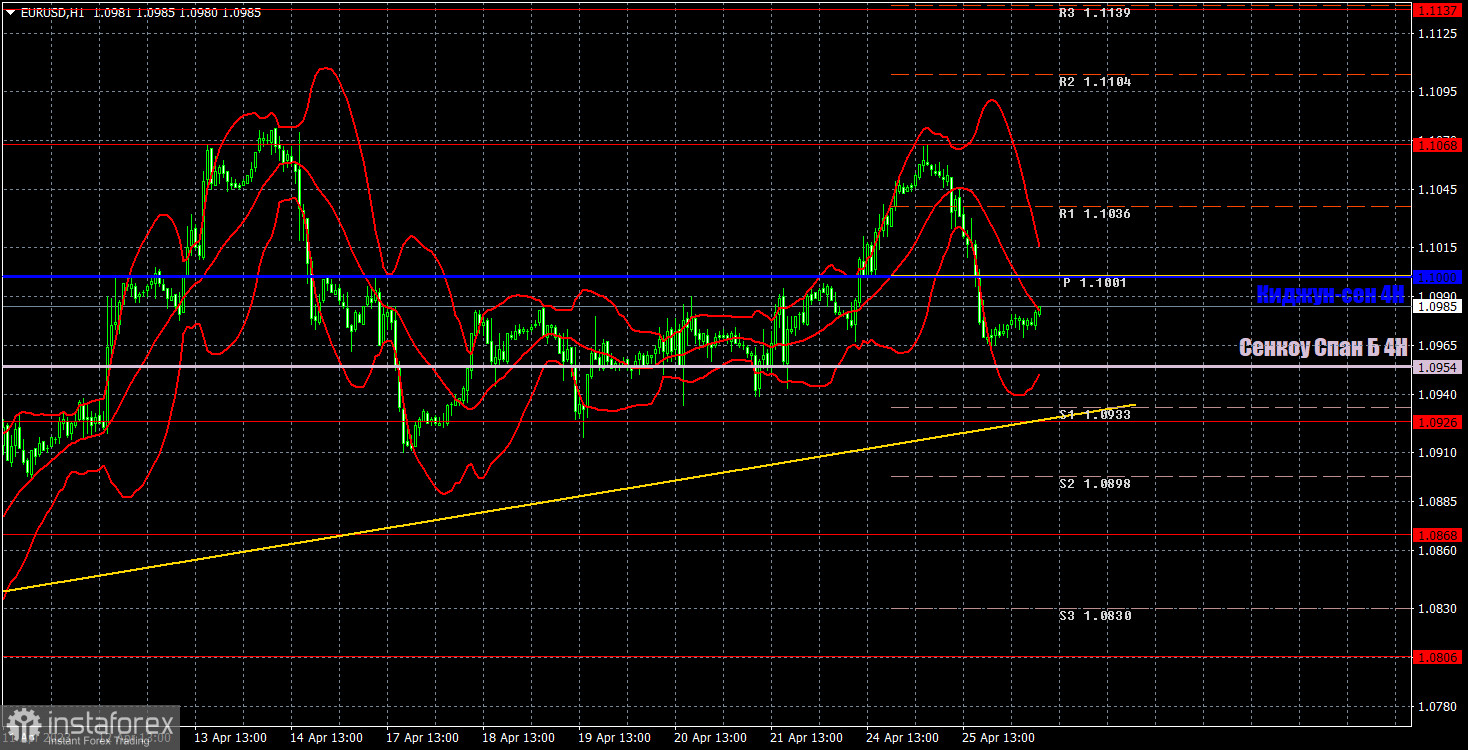
Analysis of EUR/USD 1H.
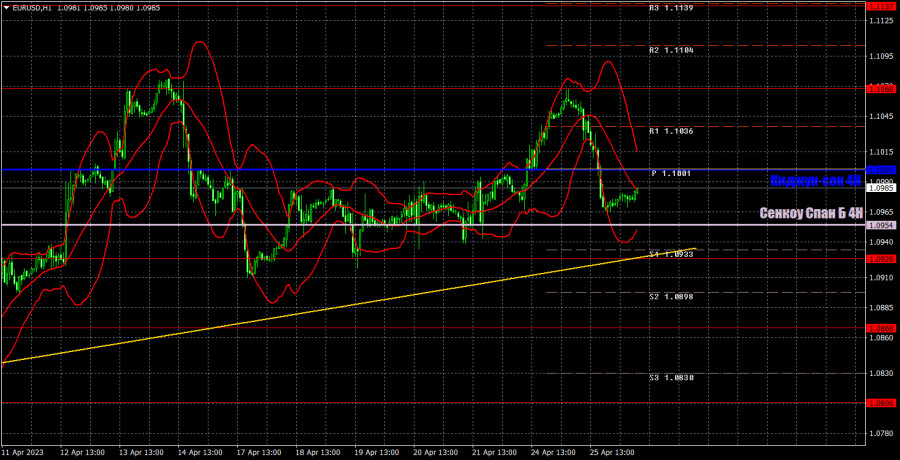
On the 1H timeframe, the pair maintains an upward trend, trading above the trend line and the Senkou Span B. However, we do not see any continuation of the upward movement, a strong correction, or a flat. The movements are quite random. It appears that in order to predict the movement of the pair, one needs to choose the most unlikely option and it will be the right one. Traders should pay attention to the following levels: 1.0762, 1.0806, 1.0868, 1.0926, 1.1068, 1.1137-1.1185, 1.1234, and 1.1274, as well as the Senkou Span B (1,0954) and Kijun-sen (1,1000) lines. The lines of the Ichimoku indicator can move during the day which should be taken into account when determining trading signals. There are also support and resistance levels. However, there are no signals at these levels, namely breakouts or rebounds. Do not forget about placing a Stop Loss order if the price went in the right direction of 15 pips. It will help you avoid potential losses if the signal turns out to be false. On April 26, the US will release durable goods orders. Although traders are likely to ignore this report, it may trigger small volatility. However, market reaction may be rather unpredictable as well as the movements of the pair during the day.
Description of charts:
Support and resistance levels are thick red lines where the price movement may end. They do not provide trading signals.
The Kijun-sen and Senkou Span B lines are the components of the Ichimoku Cloud indicator placed on the 1H from the 4H chart. They provide trading signals.
Extreme levels are thin red lines where the price bounced earlier. They provide trading signals.
Yellow lines are trend lines, trend channels, and any other technical patterns.
Indicator 1 on the COT charts is the net position size of each category of traders.
Indicator 2 on the COT charts is the net position size for the non-commercial traders.