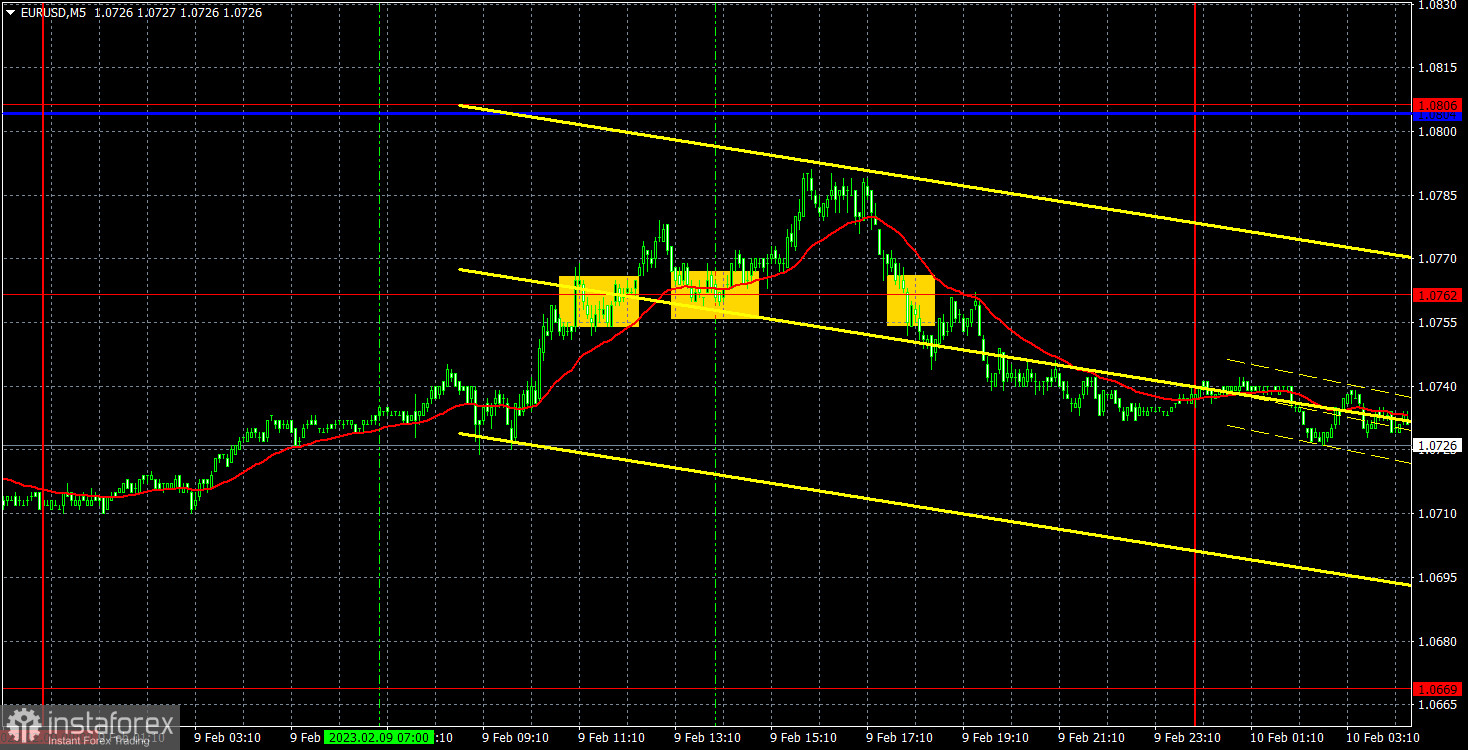
Analysis of EUR/USD on 5M timeframe
EUR/USD is trying to develop a correction for the fourth day in a row. In the 1-hour timeframe, the correction is clearly recognized. The chart signals that the price is in no hurry to move up. Let me remind you that we are waiting for a new leg lower. Indeed, the currency pair is obviously too much overbought. There are no fundamental factors for a bullish trend. The ongoing upward correction looks like a seesaw. That's why it is not comfortable to trade the instrument amid ongoing price moves. The fundamental and macroeconomic background was insignificant on Thursday and during the whole trading week. The most noteworthy event was a speech by Jerome Powell on Tuesday. All in all, the currency pair is expected to creep upward for a few more days. Then, a decline will follow. Meanwhile, EUR/USD has not been able to surpass the critical level. Thus, the downward trend is still valid.
The instrument generated a few trading signals yesterday and all of them were weak. All signals appeared at about 1.0762. First, the price overcame this level from bottom to top and dropped off instantly. As a result, the price climbed another 20 pips but didn't reach the nearest target level. Nevertheless, setting a stop loss on long positions is a must-do. My trade closed with a stop loss when a sell signal was formed. Afterwards, the currency pair went 20 pips down. Traders managed to earn 20 pips, having closed short positions manually. One way or another, traders finished the day with profits on EUR/USD.
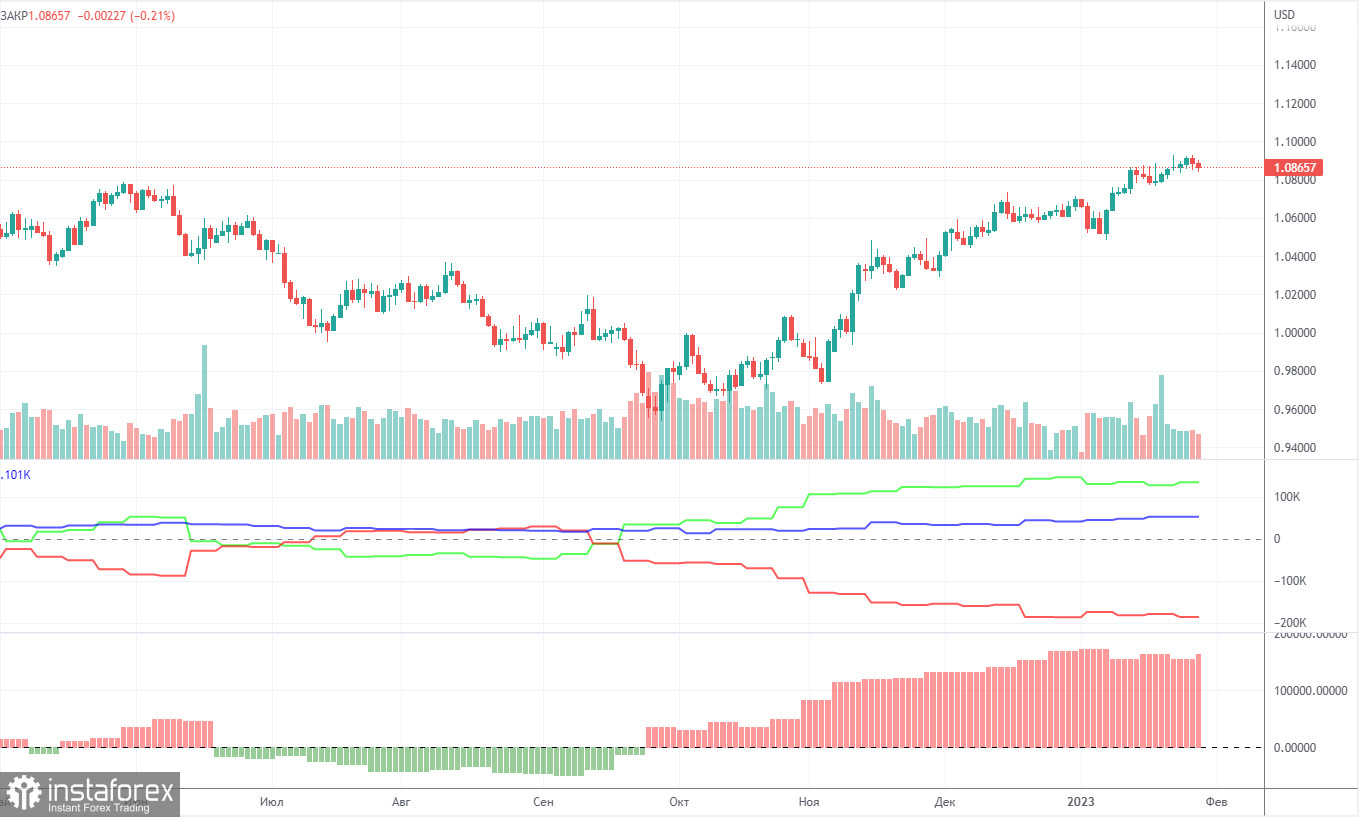
COT report
COT reports of EUR/USD correspond in full the price developments. On the chart above, we see that the net positions of large market makers have been growing since early September. Roughly in the same period, the single European currency clicked into gear. For the time being, the net positions of non-commercial traders are bullish (the second indicator). This sentiment has been cemented week after week. In fact, the high value of net positions prompts us to draw the conclusion that the bullish is about to compete soon. This is also confirmed by the first indicator because the red and green lines have been parted considerably from each other. This also often precedes the completion of the uptrend.
In the reported week, the number of buy contracts held by non-commercial traders increased by 9.5K whereas the number of short contracts grew by 2K. In turn, the net positions rose by 7.5K contracts. Now the number of buy contracts is higher by 134K than the number of sell contracts opened by non-commercial traders. The question is how long large market players are going to add buy contracts. From the technical viewpoint, the technical correction should have already begun long ago. I reckon the instrument cannot continue trading this way for another 2-3 months. The net positions signal that the price needs to retreat downward, i.e. to go through a downward correction. If we look at the overall long and short positions of all traders' categories, the number of short contracts is now 52K more than the long contracts: 732K versus 680K.
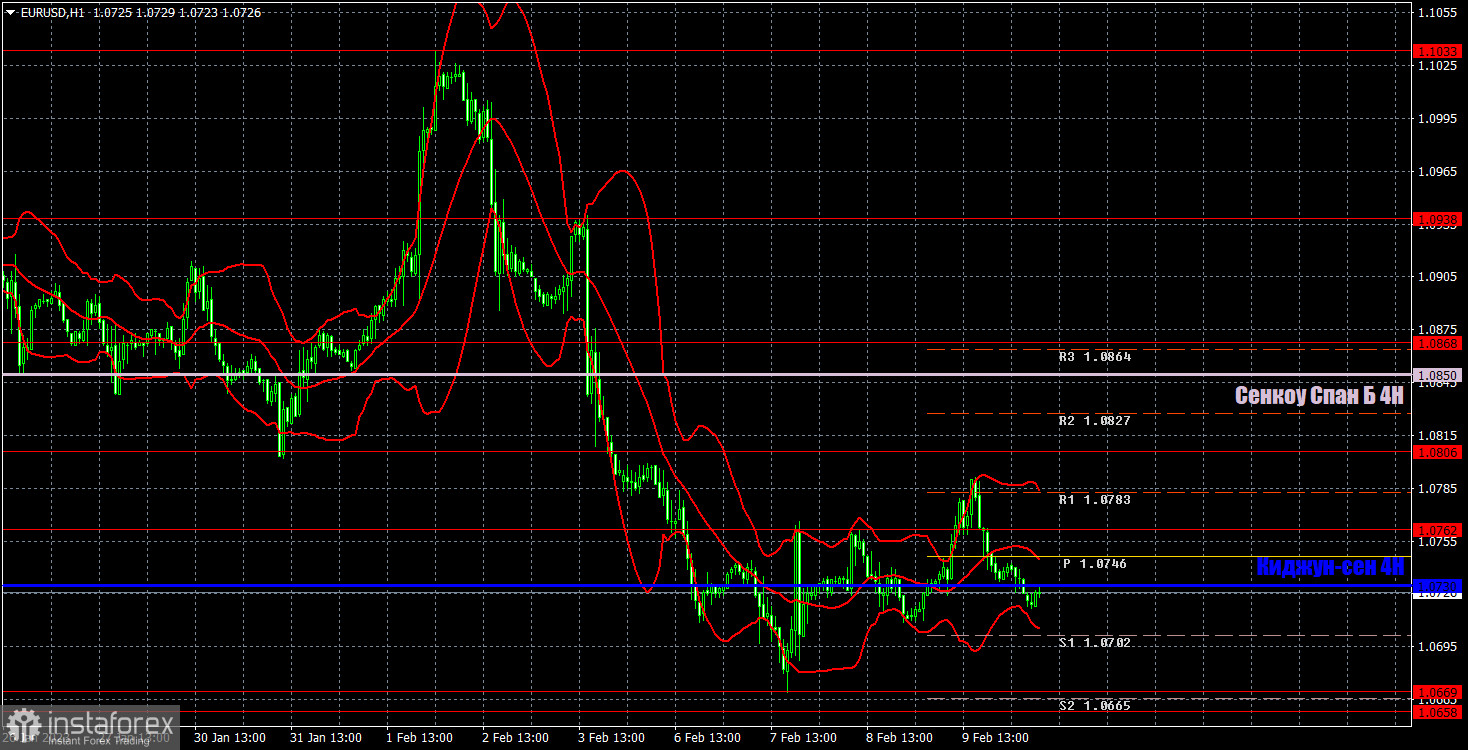
Analysis EUR/USD 1H
The currency pair is still trading lower on the 1-hour chart. We warned that the price could make inertial moves on the first days of the week. Then, the instrument could try to make a correction. This is exactly what is going on now. Currently, the pair is likely to trade sideways or make seesaw fluctuations. Below the Senkou Span B indicator, we expect a new downward move. On Friday, we pay attention to the following important levels: 1.0485, 1.0581, 1.0658-1.0669, 1.0762, 1.0806, 1.0868, 1.0938, Senkou Span B at 1.0850, and Kijun-sen at 1.0730. The lines of the Ichimoku indicator could shift during the day which should be taken into account for identifying trading signals. There are also extra support and resistance levels, but trading signals are not formed next to them. Bounces and drops as well as breakouts of swing highs and swing lows can also serve as trading signals.
Don't forget to set a stop loss for closing positions at break even if the price has moved 15 pips in the right direction. This will protect you from hypothetical losses if the signal happens to be false. No important event is scheduled for February 10 in the EU. As for the US, Fed policymakers Christopher Waller and Patrick Harker are due to speak tonight. The University of Michigan will release its consumer sentiment index.
Comments on charts
Support and resistance levels are plotted by thick red lines, near which the movement may end. Commonly, they do not generate trading signals.
The Kijun-sen and Senkou Span B lines are the Ichimoku indicator lines transferred to the 1-hour timeframe from the 4-hour timeframe. They are strong lines.
Extreme levels are thin red lines, from which the price bounced or dropped earlier. They are sources of trading signals.
Yellow lines are trend lines, trend channels, and any other technical patterns.
Indicator 1 on the COT charts is the size of the net position of each category of traders.
Indicator 2 on the COT charts is the size of the net position for the Non-commercial group.