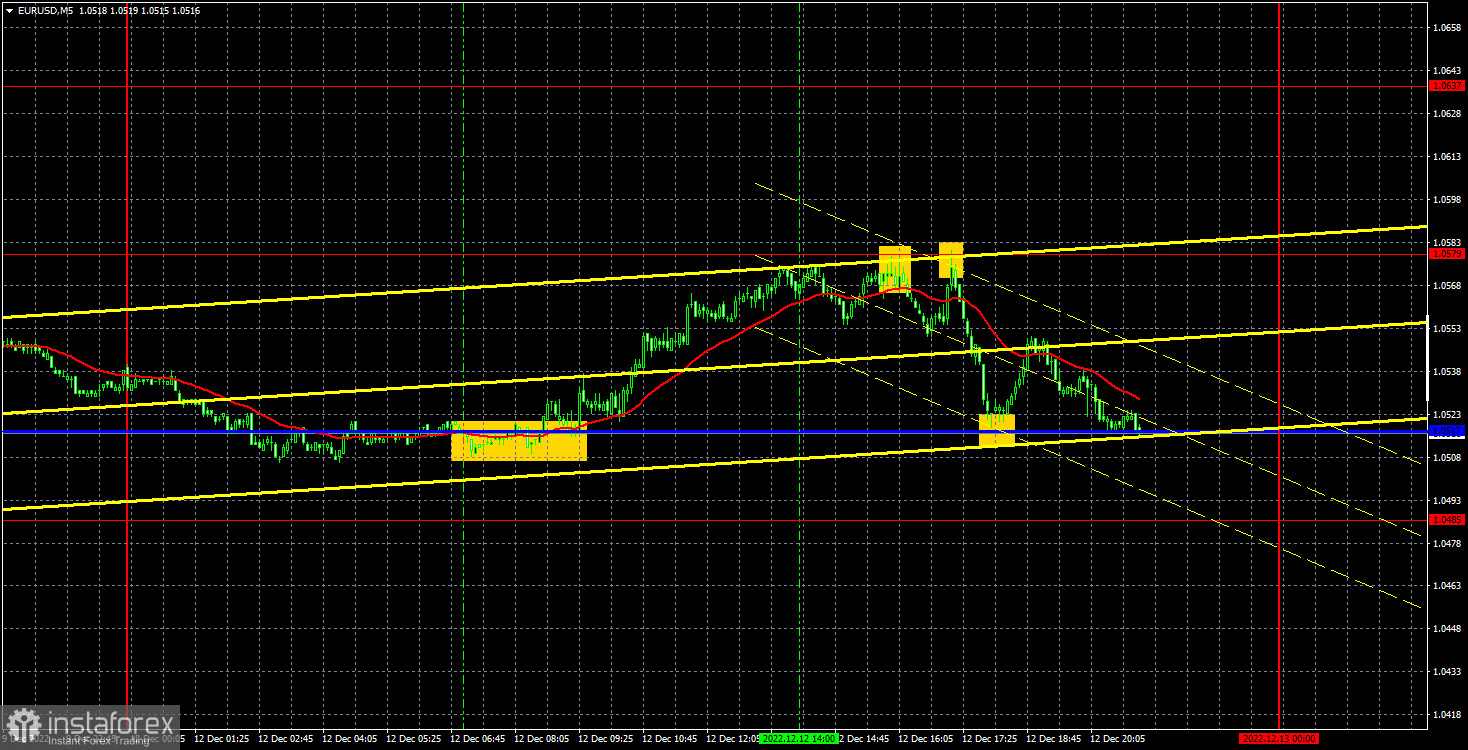
M5 chart of EUR/USD
On Monday, EUR/USD moved sideways for the most part. This is perfectly visible in the chart above. Despite the fact that the pair is still near its local highs, it can neither continue to move up, nor start a bearish correction. At the moment, the price is stuck between the critical line and 1.0579. There was no macroeconomic and fundamental background on Monday, but the pair was moving up and down during the day. However, these movements do not clarify where the euro will move in the medium term. Therefore, the only thing we can do is to wait for the central bank meetings and inflation reports. Market reaction could be mixed, but there is nothing else to do. The euro climbed too high (as well as GBP), and there aren't many support factors for it right now (only technical). Nevertheless, the market still refuses to buy the US currency.
On the bright side, the trading signals were very good. First, the pair rebounded from the Kijun-Sen line, forming a buy signal. Then it rose to 1.0579, rebounding from it twice (sell signals). Afterwards, it returned to the critical line and bounced from it. Thus, I have managed to open three deals, two of which closed with about 30 pips profit, and one without a loss. The first trading day of the week was profitable, let's hope the other days will be profitable as well.
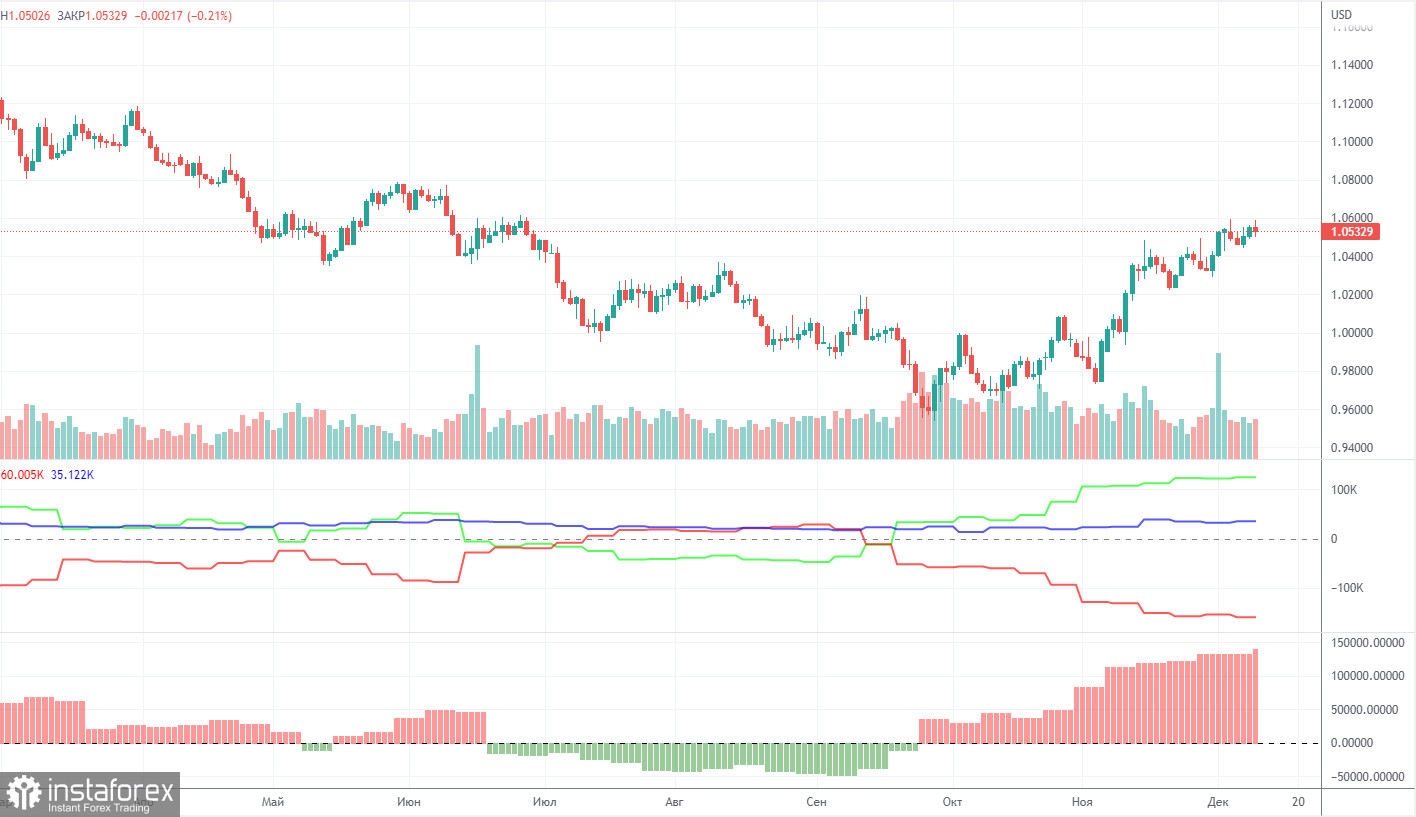
COT report
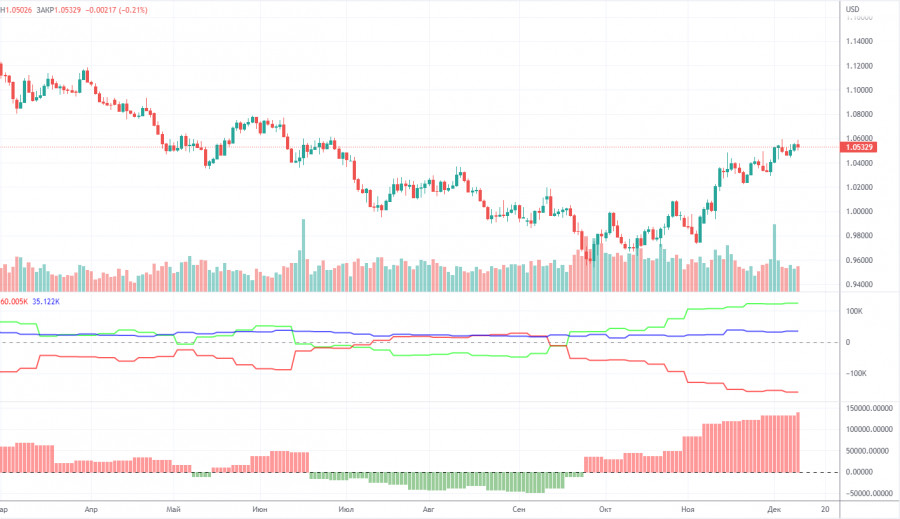
COT reports on EUR/USD have puzzled traders through most of 2022. Half of the year, COT reports indicated clear-cut bullish sentiment among large market makers while the single European currency was extending its weakness. For a few months, the reports showed a bearish sentiment and the euro was also trading lower. Currently, the net position of non-commercial traders is again bullish and increasing. Although the euro is rising, a rather high value of the net position allows us to assume an early completion of the uptrend. During the reporting week, the number of long positions held by non-commercial traders increased by 3,900 and that of short positions grew by 1,300. Accordingly, the net position grew by about 2,600 contracts. The green and red lines of the first indicator moved far away from each other, which could mean the end of the uptrend (!!!) (which, in fact, never happened). The number of long positions exceeds that of short positions by 125,000. Therefore, the net position of non-commercial traders may continue to rise further but without triggering a similar rise in the euro. When it comes to the total number of longs and shorts across all categories of traders, there are now 35,000 more short positions (661,000 vs 626,000).
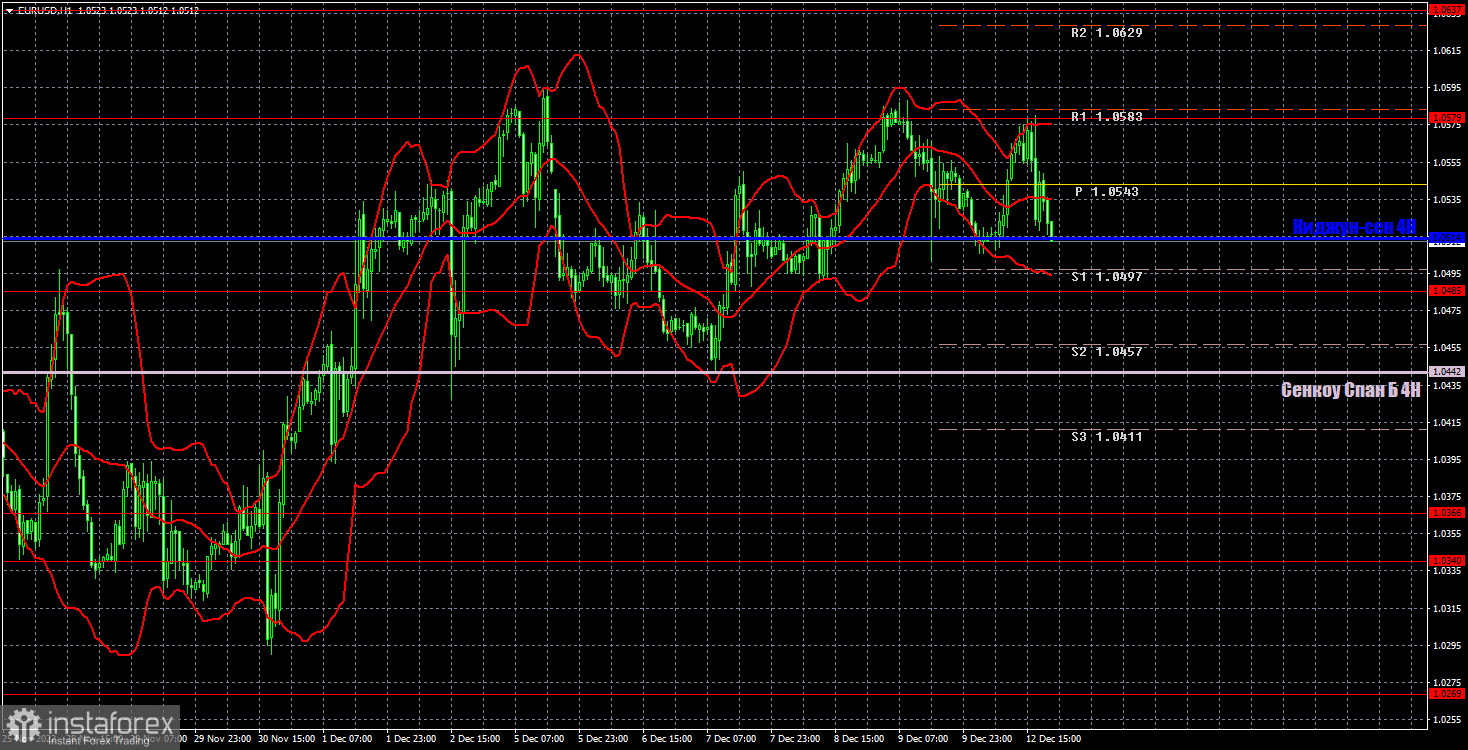
H1 chart of EUR/USD
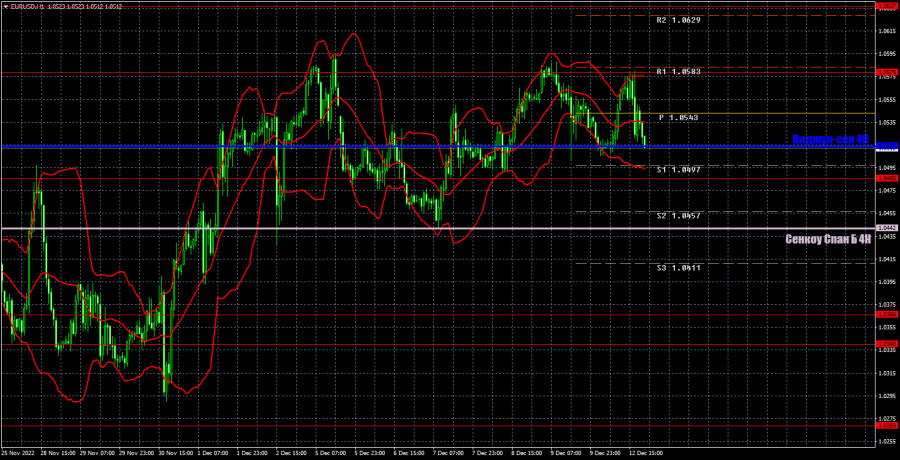
On the hour chart, EUR/USD is still near its local highs and above the Ichimoku indicator lines. At the same time, quotes have been in a limited range for more than a week, which, on the one hand, can be called a horizontal channel, but on the other hand, you can't call it that. Anyway, this week the pair may "fly" from side to side, so we should be ready for any movements. On Tuesday, the pair may trade at the following levels: 1.0195, 1.0269, 1.0340-1.0366, 1.0485, 1.0579, 1.0637, and also Senkou Span B (1.0442) and Kijun Sen (1.0514). Lines of the Ichimoku indicator may move during the day, which should be taken into account when determining trading signals. There are also support and resistance levels, but signals are not formed near these levels. Bounces and breakouts of the extreme levels and lines could act as signals. Don't forget about stop-loss orders, if the price covers 15 pips in the right direction. This will prevent you from losses in case of a false signal. On December 13, there are no important reports or events in the EU, but the US will publish the inflation report for November, which is important because the Federal Reserve's monetary policy depends on it. Therefore, the stronger the actual value deviates from the projections, the stronger the market reaction may be.
What we see on the trading charts:
Price levels of support and resistance are thick red lines, near which the movement may end. They do not provide trading signals.
The Kijun-sen and Senkou Span B lines are the lines of the Ichimoku indicator, moved to the one-hour chart from the 4-hour one. They are strong lines.
Extreme levels are thin red lines from which the price bounced earlier. They provide trading signals.
Yellow lines are trend lines, trend channels, and any other technical patterns.
Indicator 1 on the COT charts reflects the net position size of each category of traders.
Indicator 2 on the COT charts reflects the net position size for the non-commercial group.