Analysis of GBP/USD on 5M.
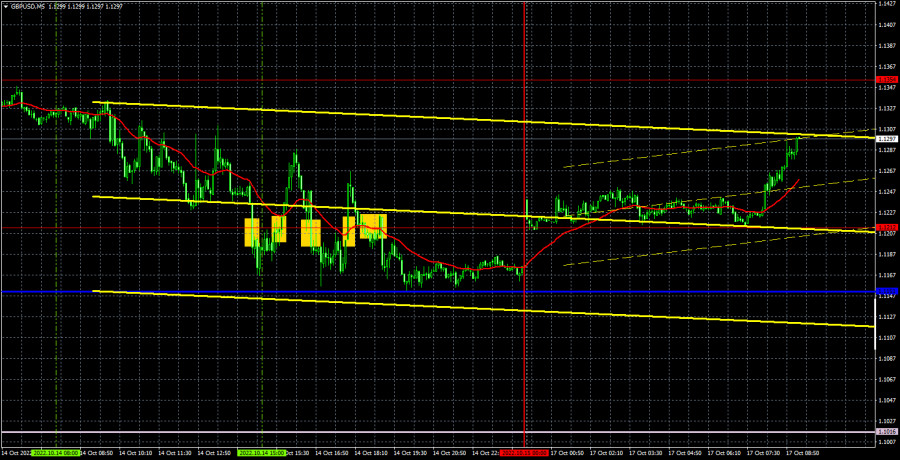
The GBP/USD pair was rather volatile last Friday, getting trapped in the downward channel almost all day. By the end of the day, it was trading near the critical level. A fall in the pound sterling last Friday was rather odd as there were no negative economic reports. However, in general, the pound sterling may collapse any day due to fundamental factors. Now, it is still located above the Ichimoku indicator, as well as above the Kijun-sen line on the 24H chart. These three lines signal the likelihood of a new uptrend. The pound sterling is now located at strong levels as it has been able to rebound by 1,000 pips from its all-time lows. However, given the political headwinds and the impending financial and economic crisis, analysts are casting doubt on a further rise.
On Friday, the movements of the pair on the 5M chart were rather sharp. The price retreated many times and declined by at least 100 pips each time. If at the start of the American session, some traders expected a drop in the US dollar due to the weak retail sales report, hardly anyone predicted a decrease in the pound sterling. Traders paid zero attention to the 1.1212 level. Therefore, all the signals appeared near 1.1212. However, it was possible to make a profit only with the help of the first two. In the first case, the price dropped by 25 pips and in the second case, it slid by about 60 pips. Therefore, in both cases, investors placed Stop Loss orders. Both trades were closed after activating this order.
COT report:

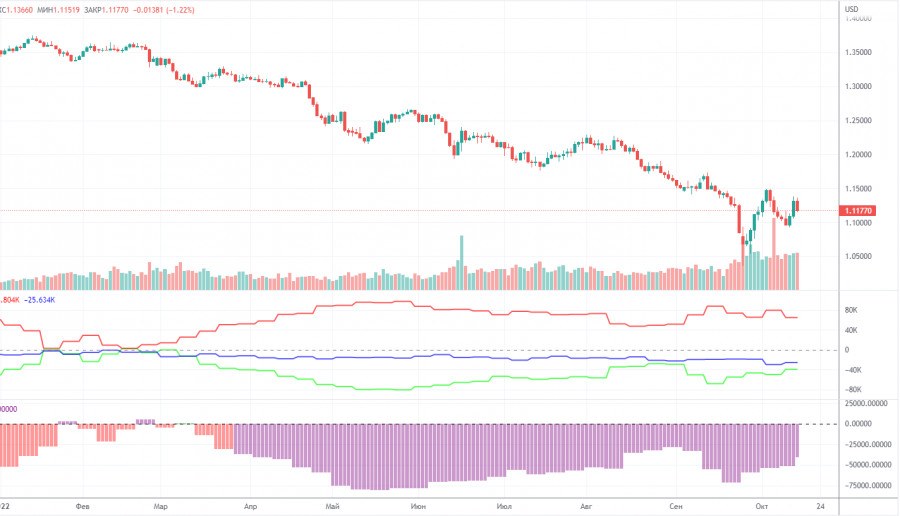
The latest COT report indicated that the bearish sentiment on GBP has weakened. During the week, non-commercial traders opened 6,900 long positions and closed 3,400 short ones. Thus, the net position of non-commercial traders increased by 1,300, which was quite a lot for the pound sterling. It appears that the market sentiment and the trajectory of the pound sterling have finally coincided. The pound has grown over the last period of net position growth. However, it may once again be a false reversal. The net position has been rising slightly in recent weeks. This is not the first time it has been growing while the sentiment is bearish. This is why the pound sterling continues to fall in the medium term. As it has already been with the euro, GDP will hardly advance considerably amid COT reports. Besides, demand for the US dollar remains high. Non-commercial investors have recently opened 88,000 short positions and 49,000 long ones. The difference is still very big. The euro is unable to rebound amid the bullish sentiment of major players. This is why the pound sterling is unlikely to rise due to strong bearish sentiment. Analysts are skeptical about the long-term growth of the British currency although some technical indicators are signaling such a likelihood.
Analysis of GBP/USD on 1H.

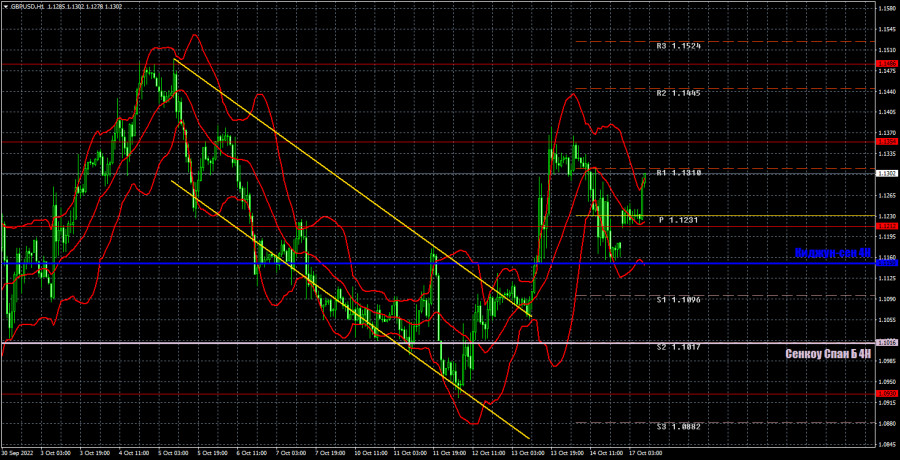
On the 1H chart, the pound/dollar pair once again escaped the downward channel, breaking through the lines of the Ichimoku indicator. On the 24H chart, the price managed to consolidate above the critical level. So, the pair may gain another 400-600 pips. However, traders should be cautious when opening new long positions due to unfavorable fundamental factors and rising geopolitical tensions. On October 17, I turned your attention to the following important levels: 1,0538, 1,0930, 1,1212, 1,1354, 1,1442, 1,1649. The Senkou Span B (1,1016) and Kijun-sen (1,1150) lines may also provide breakout or rebound signals. It is recommended to set the Stop Loss Order if the price moves by 20 pips within the trend. The lines of the Ichimoku indicator may also move during the day. Traders should keep it in mind when determining trading signals. On the charts, there are support and resistance levels that might be of use when locking in profits. The economic calendar for the UK and the US is empty on Monday. However, at the very beginning of the European session, the pound sterling has already risen by 80 pips in just 1 hour. Thus, the pound is likely to remain highly volatile today.
What we see on the trading charts:
Price levels of support and resistance are thick red lines, near which the movement may end. They do not provide trading signals.
The Kijun-sen and Senkou Span B lines are the lines of the Ichimoku indicator, moved to the one-hour chart from the 4-hour one. They are strong lines.
Extreme levels are thin red lines from which the price bounced earlier. They provide trading signals.
Yellow lines are trend lines, trend channels, and any other technical patterns.
Indicator 1 on the COT charts reflects the net position size of each category of traders.
Indicator 2 on the COT charts reflects the net position size for the non-commercial group.


