Details of the economic calendar for August 31
Eurozone inflation hit a new record high of 9.1% in August. Eurostat reports that the main growth driver is high energy prices. The high level of inflation may again push the European Central Bank to further interest rate hikes.
It is worth noting that for the past two days, most speakers from the ECB have been actively advocating the possibility of raising the ECB rate by 0.75% in September. In turn, German Chancellor Olaf Scholz says that citizens will feel a significant increase in electricity prices in September.
In simple terms, inflation in the EU will continue to grow.
During the American trading session, employment data in the United States was published. According to the ADP report, the number of jobs in the private sector in August increased by 132,000. Forecast expected an increase of 300,000.
The divergence of expectations has served as a stimulus for the local sell-off of the US dollar.
As a reminder, the ADP report is often viewed by traders as a leading indicator for the US Department of Labor report due on September 2nd.
Category "Interesting moments"
Bloomberg: Fed Chairman Jerome Powell has buried the concept of a "soft landing" of the US economy. Now the Fed's goal is to bring inflation down by slowing US economic growth below its potential level, which officials estimate at 1.8%.
Analysis of trading charts from August 31
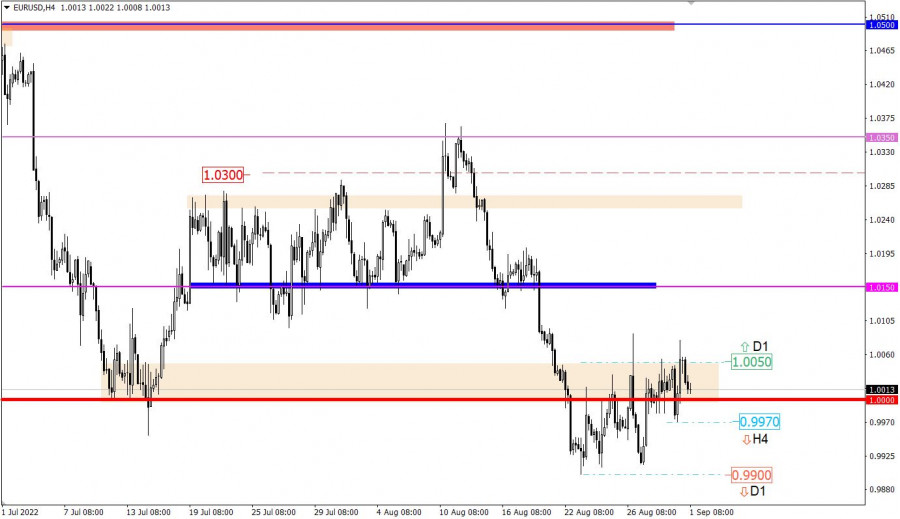
The EURUSD currency pair, despite local manifestations of activity caused by speculative interest, is still in close proximity to the parity level (1.0000). Price fluctuation within 150 points lasted for almost two weeks. This movement, in theory, can become a process of accumulation of trading forces.
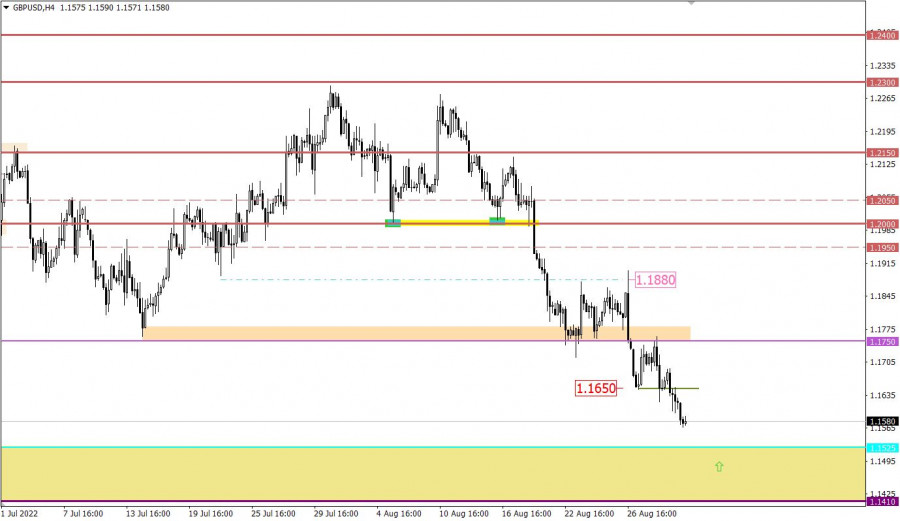
The GBP/USD currency pair gradually weakened, which resulted in a prolongation of the main downward trend.
Details:
Since August, the pound has lost 700 points (about 5.5%) of value, which is considered a strong price change, allowing short positions to overheat.
Since the beginning of the medium-term trend, June 2021, the pound has lost 2,600 points in value (about 18.5%).
Economic calendar for September 1
The final data on business activity indices in the manufacturing sector in Europe, the United Kingdom, and the United States are to be published today. If the indicators coincide with the preliminary estimate, the data will be ignored by market participants since they have already been priced in.
The EU employment data will also be published, which may rise from 6.6% to 6.7%. This is already a negative factor for the euro if the forecast matches.
During the American session, in addition to the manufacturing PMI data, weekly jobless claims in the United States will be published, where figures are assumed to rise. This is a negative factor for the US labor market, which may affect dollar positions.
Statistics details:
The volume of continuing claims for benefits may increase from 1.415 million to 1.438 million.
The volume of initial claims for benefits may increase from 243,000 to 248,000.
Time targeting:
EU Manufacturing PMI – 08:00 UTC
UK Manufacturing PMI – 08:30 UTC
EU Unemployment – 09:00 UTC
US Jobless Claims – 12:30 UTC
US Manufacturing PMI – 14:00 UTC
Trading plan for EUR/USD on September 1
A recent attempt to keep the price above 1.0050 proved unsuccessful. As a result, the quote again rolled back to the level of 1.0000. In this situation, do not rush, the tactics of work, as before, will be focused on the main move that will arise after the completion of the stage of accumulation of trading.
We concretize the above:
The upward scenario for the currency pair is taken into account after the price is held above the value of 1.0050. In order to filter out false touches, the quote needs to stay above the control value in the daily period.
The downward scenario is considered in the market in the form of two steps. The local move will be considered by the trailers at the moment the price holds below 0.9970 in a four-hour period. In this case, there is a high probability of movement towards the value of 0.9900. The main move will be relevant after holding the price below 0.9890 in the daily period. This scenario will lead to a prolongation of the trend.
Trading plan for GBP/USD on September 1
In this situation, market participants set their sights on the local low of 2020. There are about 150 points left to go, but given the growing oversold level of the pound sterling, a full-length technical correction is possible.
The price area 1.1410/1.1525 can serve as a support on the way of sellers.
What is shown in the trading charts?
A candlestick chart view is graphical rectangles of white and black light, with sticks on top and bottom. When analyzing each candle in detail, you will see its characteristics of a relative period: the opening price, closing price, and maximum and minimum prices.
Horizontal levels are price coordinates, relative to which a stop or a price reversal may occur. These levels are called support and resistance in the market.
Circles and rectangles are highlighted examples where the price of the story unfolded. This color selection indicates horizontal lines that may put pressure on the quote in the future.
The up/down arrows are the reference points of the possible price direction in the future.


