empty
 
 
10.02.2022 09:45 AM
Trading plan for starters of EUR/USD and GBP/USD on February 10, 2022

Here are the details of the economic calendar for February 9:

The macroeconomic calendar is empty for the third day in a row, market dynamics are low, and quotes follow technical patterns.

Analysis of trading charts from February 9:

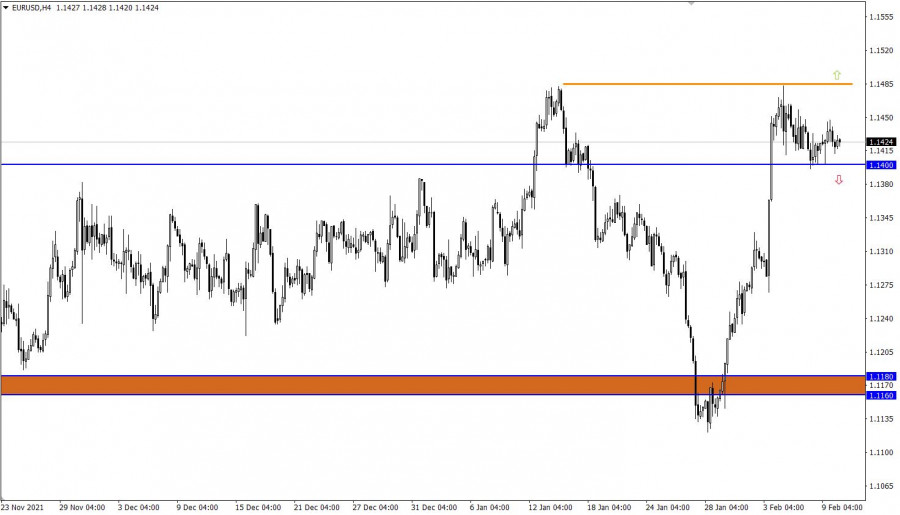
The EUR/USD pair has been moving inside the side channel of 1.1400/1.1480 for the fifth day in a row, showing low activity. The characteristic stagnation leads to confusion in the market, but it is worth considering that we are currently dealing with the process of accumulation of trading forces in the upcoming acceleration.

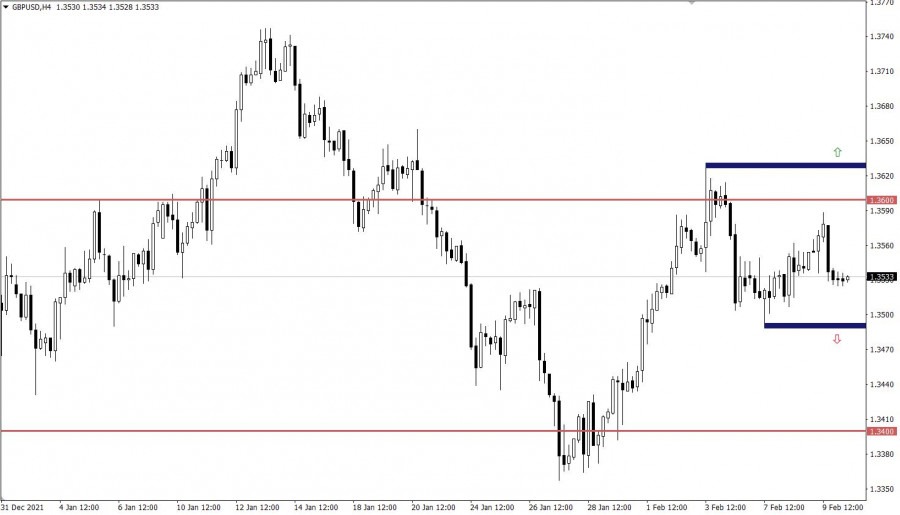
The GBP/USD pair continues to concentrate within its deviation despite the rebound from the resistance level of 1.3600 last week. This signals a characteristic uncertainty among traders, which may play into the hands of speculators.

This image is no longer relevant

February 10 economic calendar:

The US inflation data may have a strong impact on the market after an empty macroeconomic calendar for several consecutive days. So, it is expected that consumer prices will continue to grow from 7.0% to 7.3%. This will definitely provoke speculators to action.

Weekly data on applications for US unemployment benefits will also be published, where a slight reduction in their volume is predicted. This is a positive factor for the US labor market.

Statistics details:

  • The volume of initial applications for benefits may be reduced from 238 thousand to 230 thousand
  • The volume of repeated applications for benefits may be reduced from 1,628 thousand to 1,615 thousand.

Time targeting

US inflation - 13:30 Universal time

Applications for US unemployment benefits - 13:30 Universal time

Trading plan for EUR/USD on Feb 10:

The quote is currently moving in the range of 1.1400/1.1480. It can be assumed that a long-term price movement in a closed amplitude will lead to a regular acceleration if the price is kept outside one or another border.

Therefore, the trading tactic is focused on the breakdown of the flat, which will indicate an impulse movement soon.

We express the above-mentioned into trading signals:

Buy positions should be considered after holding the price above 1.1485 in a four-hour period, with the prospect of moving to 1.1580.

Sell positions should be considered after holding the price below 1.1400 in a four-hour period, with the prospect of moving to 1.1350 - 1.1300.

This image is no longer relevant

Trading plan for GBP/USD on Feb 10:

In this situation, the price movement between the resistance level of 1.3600 and the variable pivot point of 1.3500 indicates the process of accumulation of trading forces. At the same time, several Doji-type candlesticks in the daily chart can act as a lever, where an impulse move will be obtained as a result.

Therefore, trading within the established range is considered less attractive than trading on its breakdown. The following values serve as signal levels: 1.3630, when considering buy positions, and 1.3480, if the decline from the resistance level is prolonged towards the level of 1.3400.

This image is no longer relevant

What is reflected in the trading charts?

A candlestick chart view is graphical rectangles of white and black light, with sticks on top and bottom. When analyzing each candle in detail, you will see its characteristics of a relative period: the opening price, closing price, and maximum and minimum prices.

Horizontal levels are price coordinates, relative to which a stop or a price reversal may occur. These levels are called support and resistance in the market.

Circles and rectangles are highlighted examples where the price of the story unfolded. This color selection indicates horizontal lines that may put pressure on the quote in the future.

The up/down arrows are the reference points of the possible price direction in the future.

Gven Podolsky,
Analytical expert of InstaForex
© 2007-2024
通过InstaForex赚取加密货币汇率变动的收益。
下载MetaTrader 4并开启您的第一笔交易。
  • Grand Choice
    Contest by
    InstaForex
    InstaForex always strives to help you
    fulfill your biggest dreams.
    JOIN CONTEST
  • Chancy Deposit
    Deposit your account with $3,000 and get $3000 more!
    In September we raffle $3000 within the Chancy Deposit campaign!
    Get a chance to win by depositing $3,000 to a trading account. Having fulfilled this condition, you become a campaign participant.
    JOIN CONTEST
  • Trade Wise, Win Device
    Top up your account with at least $500, sign up for the contest, and get a chance to win mobile devices.
    JOIN CONTEST
  • 100% Bonus
    Your unique opportunity to get a 100% bonus on your deposit
    GET BONUS
  • 55% Bonus
    Apply for a 55% bonus on your every deposit
    GET BONUS
  • 30% Bonus
    Receive a 30% bonus every time you top up your account
    GET BONUS

推荐文章

现在无法通话?
提出您的问题,用 在线帮助.
Widget callback