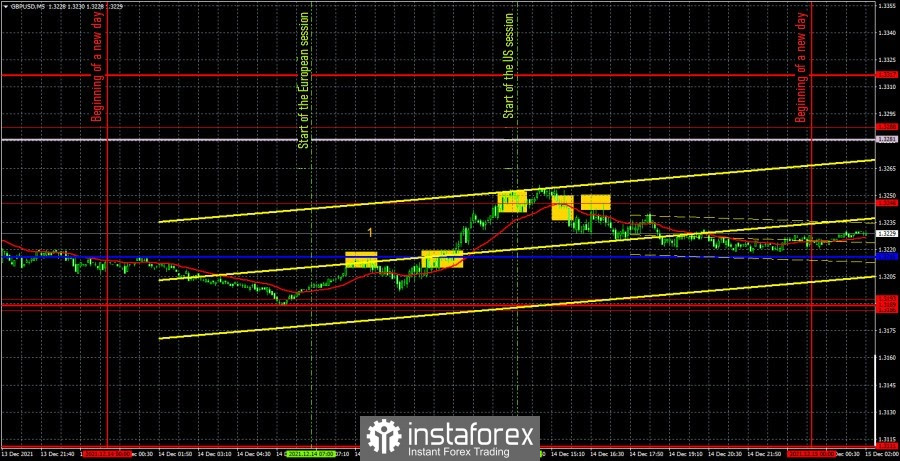
GBP/USD 5M

The GBP/USD pair was not trading very actively on Tuesday. The volatility of the day was about 70 points, which is not much for the pound. In addition, the pound/dollar pair is also inside the horizontal channel, limited by the level of 1.3186 and the Senkou Span B line (1.3265). Thus, both major currency pairs are now flat. Based on this, the conclusion is obvious: on the eve of the most important meetings of the Federal Reserve, the European Central Bank and the Bank of England, the markets absolutely do not want to take unnecessary risks and want to wait for the results first, and then open deals. Therefore, the flat may persist until tomorrow evening. However, macroeconomic statistics were published in the UK today (figure "1" in the chart). In the morning, there were reports on unemployment (a decrease to 4.2%), on applications for unemployment benefits (-49,800), as well as on wages (+4.9%). Note that all three reports turned out to be better than predicted, so they should have provoked at least a slight strengthening of the British currency, but not a fall. It is this important moment that is the basis for not opening short positions on the pound at the time of the formation of the first sell signal, when the pair bounced off the critical line. The second signal - to buy - could already be worked out. The pair overcame the Kijun-sen line and subsequently rose to the extreme level of 1.3246. Initially, the pair overcame it and only a little later settled back below it. Therefore, the long position should have been closed manually when the price went below 1.3246. The profit on this transaction was about 10 points. Short positions should have been opened immediately at the same signal. However, the downward movement could not continue until the evening, and the nearest Kijun-sen line was never worked out. As a result, the short position should have been closed manually at zero profit. In general, there was a small distance between the key levels and the lines, so the trades were not too profitable.
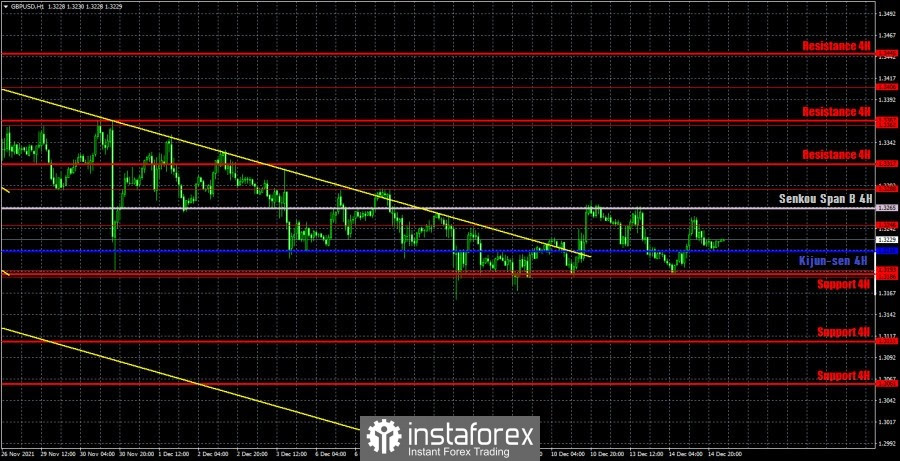
GBP/USD 1H

On the hourly timeframe, the pound/dollar pair, after leaving the descending channel, tries to start an upward trend with all its might, but the bulls cannot lead the pair above the Senkou Span B line. Or they don't want to. Thus, at the moment, a flat is being identified, which may end tonight. We also immediately recall that volatility often increases after the Fed meeting, but at the same time the pair shows versatile movements. And everything ends where it began. We highlight the following important levels on December 15: 1.3186 - 1.3193, 1.3246, 1.3288, 1.3362, 1.3406. There are no levels below, as the price has not been so low for more than a year. The Senkou Span B (1.3265) and Kijun-sen (1.3216) lines can also be signal sources. Signals can be "rebounds" and "breakthroughs" of these levels and lines. It is recommended to set the Stop Loss level to breakeven when the price passes in the right direction by 20 points. The lines of the Ichimoku indicator can move during the day, which should be taken into account when searching for trading signals. On Wednesday, an important inflation report will be published in the UK in the morning, which may provoke a strong movement. Of course, traders can ignore this report, as a much more important event awaits them in the evening. But still, we believe that a reaction will follow. The main thing is that it should be a logical reaction, and not like yesterday. A rather interesting retail sales report will also be released in America, and in the evening there will be a summary of the Fed meeting and a press conference with Jerome Powell.
We recommend you to familiarize yourself:
Overview of the EUR/USD pair. December 15. Fed monetary policy in 2022: a fortune-telling on the coffee grounds.
Overview of the GBP/USD pair. December 15. The UK could be swept up by the omicron strain in January 2022.
Forecast and trading signals for EUR/USD for December 15. Detailed analysis of the movement of the pair and trade deals.
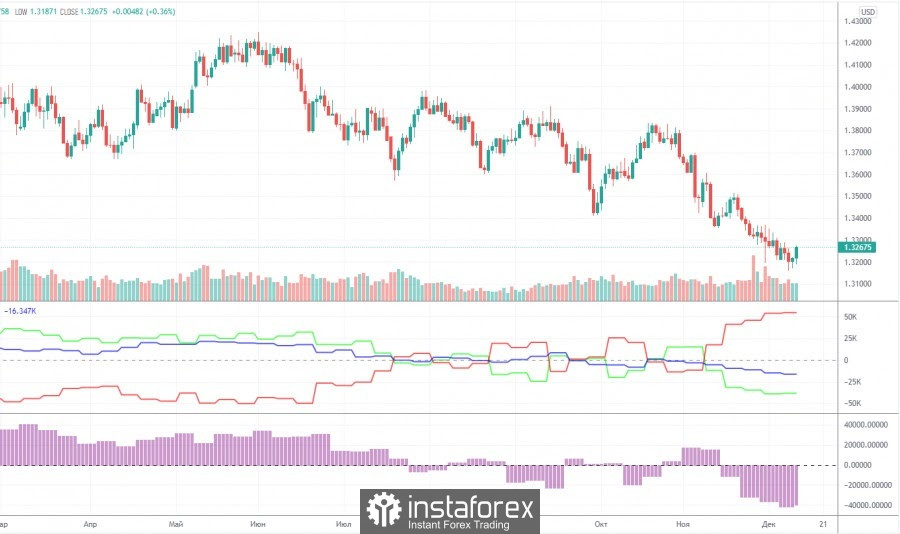
COT report

The mood of professional traders became a little less bearish during the last reporting week (November 30 – December 6). Professional traders closed 3,600 sell contracts (shorts) and 2,100 buy contracts (longs) during the week. Thus, the net position for the "non-commercial" group of traders increased by 1,500 contracts. This is a very small change even for the British pound. In general, the mood of non-commercial traders continues to be bearish, and quite strong. We draw your attention to how low the green line of the first indicator is located in the chart above, which reflects the net position of the non-commercial group. Thus, unlike the euro, the pound's decline in recent weeks looks just logical: major players sell off the currency, and it falls. A further decline in the British currency is also now quite likely, but at the same time we draw your attention to the fact that the green and red lines of the first indicator have moved quite far from each other. This may indicate that the downward trend is drying up. Thus, we get a situation in which the euro currency is not moving down quite logically, and the pound may complete its movement in the near future. Thus, for both major pairs, we recommend waiting for the downward trend to end, but do not start buying until specific buy signals are formed.
Explanations for the chart:
Support and Resistance Levels are the levels that serve as targets when buying or selling the pair. You can place Take Profit near these levels.
Kijun-sen and Senkou Span B lines are lines of the Ichimoku indicator transferred to the hourly timeframe from the 4-hour one.
Support and resistance areas are areas from which the price has repeatedly rebounded off.
Yellow lines are trend lines, trend channels and any other technical patterns.
Indicator 1 on the COT charts is the size of the net position of each category of traders.
Indicator 2 on the COT charts is the size of the net position for the non-commercial group.