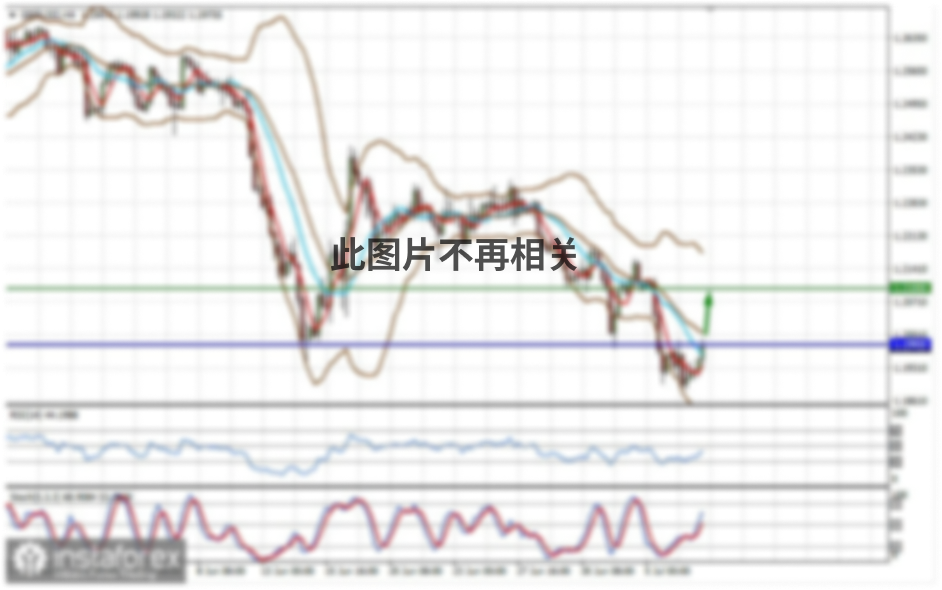
GBP/USD 1H
The GBP/USD pair also continued to correct on Monday, October 26. The pair reached the support area of 1.3004-1.3024 several times during the day, as well as the Kijun-sen line. Thus, the bears continued to put pressure on the pair, but they still have the Senkou Span B line on their way. In general, the Senkou Span B line is still the last obstacle for the bears on the way to forming a new downward trend under these conditions. Trading on Monday was rather sluggish, however, this is not surprising, given the lack of important news. Moreover, if sellers manage to overcome the Senkou Span B line, we will consider that this is absolutely logical, since the overall fundamental background for the pound remains extremely weak. A descending channel also appeared today, above which it will be possible to conclude that the bulls are taking over the initiative.
GBP/USD 15M
Both linear regression channels are directed downward on the 15-minute timeframe, which indicates a continuing downward correction on the hourly chart and there are no signs of its completion.
COT report

The new Commitments of Traders (COT) report for the pound showed that non-commercial traders were quite active during October 13 to 19. However, at the same time, the last few reports have completely made the situation complicated. The "non-commercial" group of traders opened 4,485 Buy-contracts (longs) and closed 4,072 Sell-contracts (shorts). Thus, the net position of professional traders immediately grew by 8,500 contracts, which is quite a lot for the pound. However, the problem is that non-commercial traders have been building up their net position (strengthening the bullish sentiment) over the past few weeks, and before that they have reduced their net position for several weeks (strengthening the bearish sentiment). Thus, over the past months, professional players have not even been able to decide in which direction to trade. The fundamental background continues to be very difficult and ambiguous for the pound/dollar pair, which is why the trades are so confusing. The pound sterling lost approximately 110 points during the reporting period. And the net positions of commercial and non-commercial traders are now practically zero. In other words, both the most important and largest groups of traders have approximately the same number of Buy and Sell contracts open. Naturally, such data from the COT report does not allow any conclusions, either short-term or long-term.
No major publications in the UK on Monday. Moreover, traders did not receive any important information regarding the progress of Brexit negotiations. There was no confirmation that any progress was made in these very talks. There was only news about the coronavirus that continues to overwhelm the UK. Accordingly, traders continued a moderate sell-off of the pound, based on the technical overbought currency and the absence (so far) of the prospects for signing a free trade deal. We might receive positive news about the London-Brussels talks this week, and the pound could grow in this case. But there are none as of the moment. The UK will publish a secondary report on retail sales on Tuesday, which market participants have always ignored. They might also brush off the US report on durable goods orders. Accordingly, we do not expect strong movements in the pound/dollar pair on Tuesday.
We have two trading ideas for October 27:
1) Buyers for the pound/dollar pair failed to stay above the Kijun-sen line. Thus, long positions have ceased to be relevant, as the entire upward trend is called into question. You are advised to re-consider the option of longs in case the price settles above the critical line (1.3043) and a descending channel appears with the target on the resistance area of 1.3160 -1.3184. Take Profit in this case will be up to 110 points.
2) Sellers have made several steps towards the new downward trend, but now they need to confidently overcome the Senkou Span B line (1.2971). You can consider options for opening sell orders, but only below this line while aiming for 1.2897 and the support area of 1.2857-1.2872. Take Profit in this case can range from 50 to 80 points.
Explanations for illustrations:
Support and Resistance Levels are the levels that serve as targets when buying or selling the pair. You can place Take Profit near these levels.
Kijun-sen and Senkou Span B lines are lines of the Ichimoku indicator transferred to the hourly timeframe from the 4-hour one.
Support and resistance areas are areas from which the price has repeatedly rebounded off.
Yellow lines are trend lines, trend channels and any other technical patterns.
Indicator 1 on the COT charts is the size of the net position of each category of traders.
Indicator 2 on the COT charts is the size of the net position for the "non-commercial" group.


