Analysis of EUR/USD 5M
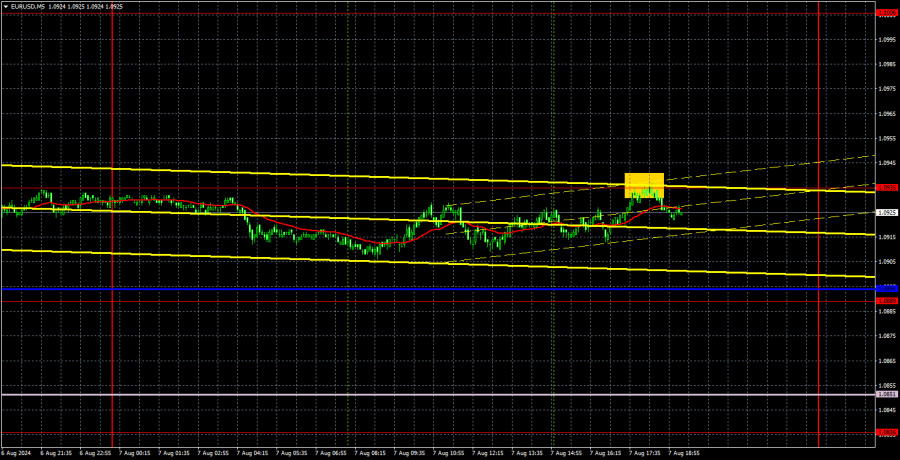
The EUR/USD pair finally calmed down on Wednesday. Volatility dropped to the levels typical of recent months, with no significant movements. Aside from the lack of movement, there was also a lack of macroeconomic and fundamental backgrounds, except for a lone and insignificant report on industrial production in Germany, which had no impact on market sentiment.
Thus, the euro remained where it was at the close of Tuesday. The dollar is not in a hurry to make up for last Friday's losses. The market is still wary of an emergency Federal Reserve meeting or a key rate cut of 0.5% in September. However, in such a case, the dollar will not rise until the meeting on September 18. Therefore, if the Fed cuts the key rate even by 0.25%, it will be a new reason to sell the US currency. Overall, the outlook for the dollar is quite unattractive.
Under these circumstances, only technical factors can save the dollar since the market does not want to react to the fundamental background. It is worth noting that the pair remains in the horizontal channel of 1.06-1.10. Therefore, a rebound from the upper boundary of this channel may trigger a fall to the lower boundary.
As soon as volatility dropped to recent months' levels, trading signals ceased to form. Yesterday, only one sell signal was formed in the evening, which did not lead to any significant drop.
COT report:
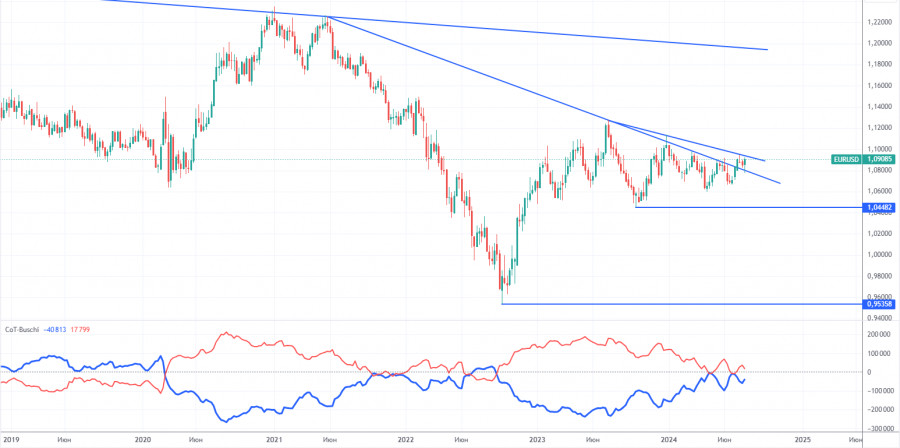
The latest COT report is dated July 30. The illustration above shows that the net position of non-commercial traders has been bullish for a long time and remains so at this time. The bears' attempt to move into their zone of dominance failed miserably. The net position of non-commercial traders (red line) has declined in recent months, while that of commercial traders (blue line) has grown. They are roughly equal at this time, suggesting a new attempt by the bears to retake the lead.
We also still do not see any fundamental factors allowing the euro to gain significant momentum, and the technical analysis tells us that the price is in the consolidation zone—in other words, in a flat range. The general downtrend in the euro remains, but the market decided to take a break for six months.
At the moment, the red and blue lines are slightly moving away from each other, which indicates that long positions on the single currency are increasing. However, given the flat conditions, such changes cannot be the basis for long-term conclusions. During the last reporting week, the number of longs in the non-commercial group decreased by 5,900, while the number of shorts increased by 12,100. Accordingly, the net position decreased by 18,000. According to COT reports, the euro still has the potential for decline.
Analysis of EUR/USD 1H
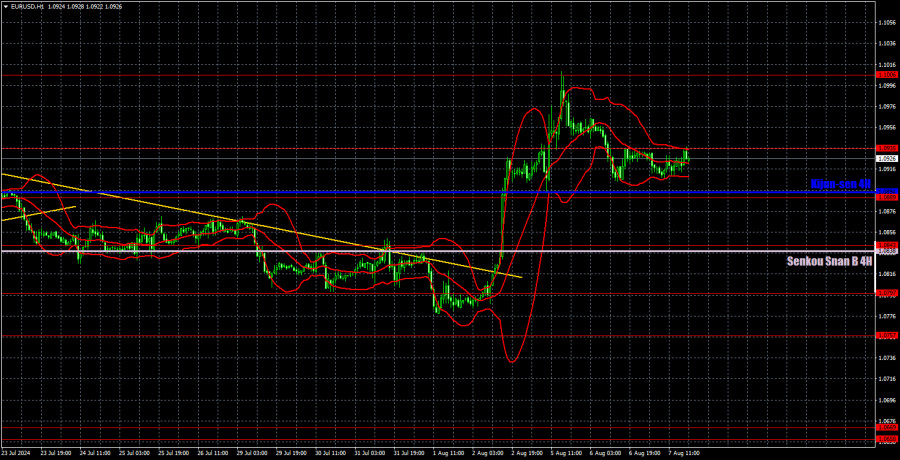
In the hourly time frame, EUR/USD showed a sharp and strong rise, but, from our perspective, it does not offer "great prospects" for the euro. There was panic in the markets on Friday and Monday, yet the euro remains within the same horizontal channel of 1.0600-1.1000, as it has for the past seven months. We believe there is a high likelihood of a rebound from the 1.1000 level with a further decline down to 1.0600. As it turned out on Tuesday, the Fed does not share the market's panic and is not planning to hold an emergency meeting to lower the key rate.
For August 8, we highlight the following levels for trading: 1.0530, 1.0581, 1.0658-1.0669, 1.0757, 1.0797, 1.0843, 1.0889, 1.0935, 1.1006, 1.1092, as well as the Senkou Span B (1.0838) and Kijun-sen (1.0894) lines. The Ichimoku indicator lines can move during the day, so this should be considered when identifying trading signals. Remember to set a Stop Loss to break even if the price has moved in the intended direction by 15 pips. This will protect you against potential losses if the signal turns out to be false.
No significant events are scheduled in the US or the European Union on Thursday. The market has calmed down after Friday and Monday's events, so volatility may now be low. We believe the euro should sustain its decline, but the price needs to at least consolidate below the Kijun-sen line. New growth prospects will only open above the tenth level.
Explanation of illustrations:
Support and resistance levels: Thick red lines near which the trend may end.
Kijun-sen and Senkou Span B lines: These Ichimoku indicator lines, transferred from the 4-hour timeframe to the hourly chart, are strong lines.
Extreme levels: Thin red lines from which the price previously bounced. These provide trading signals.
Yellow lines: Trend lines, trend channels, and other technical patterns.
Indicator 1 on COT charts: The net position size for each category of traders


