empty
 
 
17.07.2023 10:35 AM
EUR/USD and GBP/USD: Trading plan for beginners on July 17, 2023

Details of the economic calendar on July 14

On Friday, the macroeconomic calendar was empty. No important statistical data for Europe, the United Kingdom, and the United States were published.

Analysis of trading charts from July 14

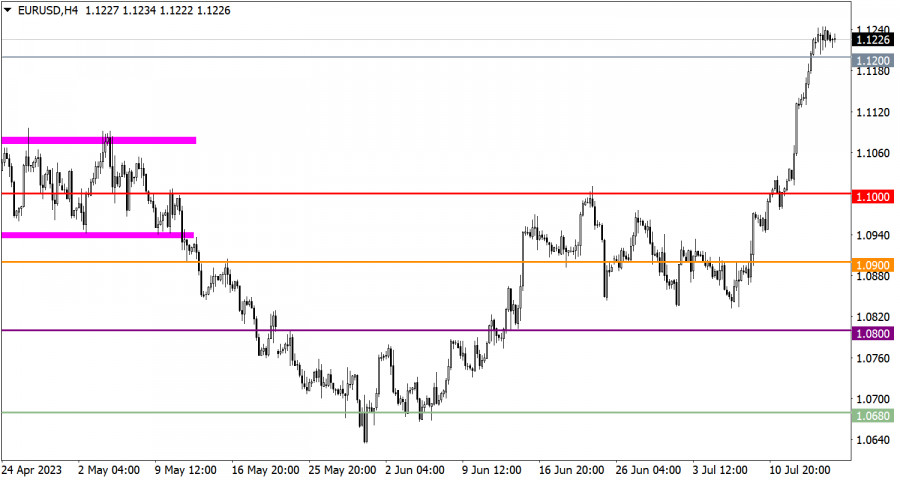
EUR/USD ended the past week in a stagnation just below the 1.1250 level. This price movement may indicate a possible reduction in long positions on the euro.

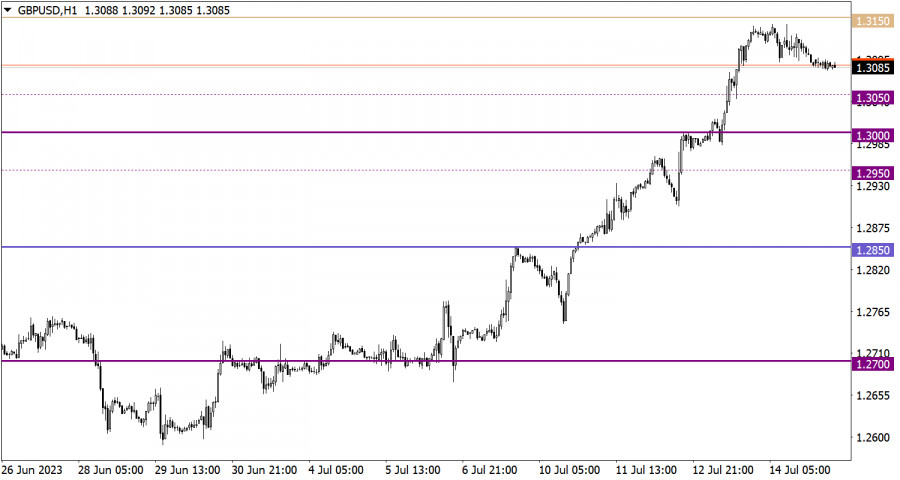
GBP/USD continued its momentum and almost reached the 1.3150 mark, where a reduction in the volume of long positions occurred. This led to stagnation and a possible price correction.

Economic calendar for July 17

Monday is traditionally accompanied by an empty macroeconomic calendar. No important statistical data is expected to be published in the European Union, the United Kingdom, and the United States.

In this regard, investors and traders intend to rely on incoming news and information flow.

This image is no longer relevant

EUR/USD trading plan for July 17

Despite the clear technical signal of overbought conditions, the euro continues its upward momentum. Holding the price above the 1.1250 level could lead to further growth, ignoring technical signals about overheating of long positions.

Regarding the price correction scenario, holding the price below the 1.1200 level may contribute to an increase in short positions. In that case, the upward trend will temporarily be interrupted, and a price correction is possible.

This image is no longer relevant

GBP/USD trading plan for July 17

Considering the overbought nature of long positions on the British pound, it can be assumed that the correction may enter an active phase and lead to a weakening of the exchange rate to the 1.3000 level. However, it is worth noting that speculators have the ability to ignore technical signals, and if the price remains above the 1.3150 level, it may lead to a continuation of the upward momentum.

This image is no longer relevant

What's on the charts

The candlestick chart type is white and black graphic rectangles with lines above and below. With a detailed analysis of each individual candle, you can see its characteristics relative to a particular time frame: opening price, closing price, intraday high and low.

Horizontal levels are price coordinates, relative to which a price may stop or reverse its trajectory. In the market, these levels are called support and resistance.

Circles and rectangles are highlighted examples where the price reversed in history. This color highlighting indicates horizontal lines that may put pressure on the asset's price in the future.

The up/down arrows are landmarks of the possible price direction in the future.

Gven Podolsky,
Analytical expert of InstaForex
© 2007-2024
Earn on cryptocurrency rate changes with InstaForex
Download MetaTrader 4 and open your first trade
  • Grand Choice
    Contest by
    InstaForex
    InstaForex always strives to help you
    fulfill your biggest dreams.
    JOIN CONTEST
  • Chancy Deposit
    Deposit your account with $3,000 and get $3000 more!
    In September we raffle $3000 within the Chancy Deposit campaign!
    Get a chance to win by depositing $3,000 to a trading account. Having fulfilled this condition, you become a campaign participant.
    JOIN CONTEST
  • Trade Wise, Win Device
    Top up your account with at least $500, sign up for the contest, and get a chance to win mobile devices.
    JOIN CONTEST
  • 100% Bonus
    Your unique opportunity to get a 100% bonus on your deposit
    GET BONUS
  • 55% Bonus
    Apply for a 55% bonus on your every deposit
    GET BONUS
  • 30% Bonus
    Receive a 30% bonus every time you top up your account
    GET BONUS

Recommended Stories

Can't speak right now?
Ask your question in the chat.
Widget callback