Analysis of GBP/USD 5M.
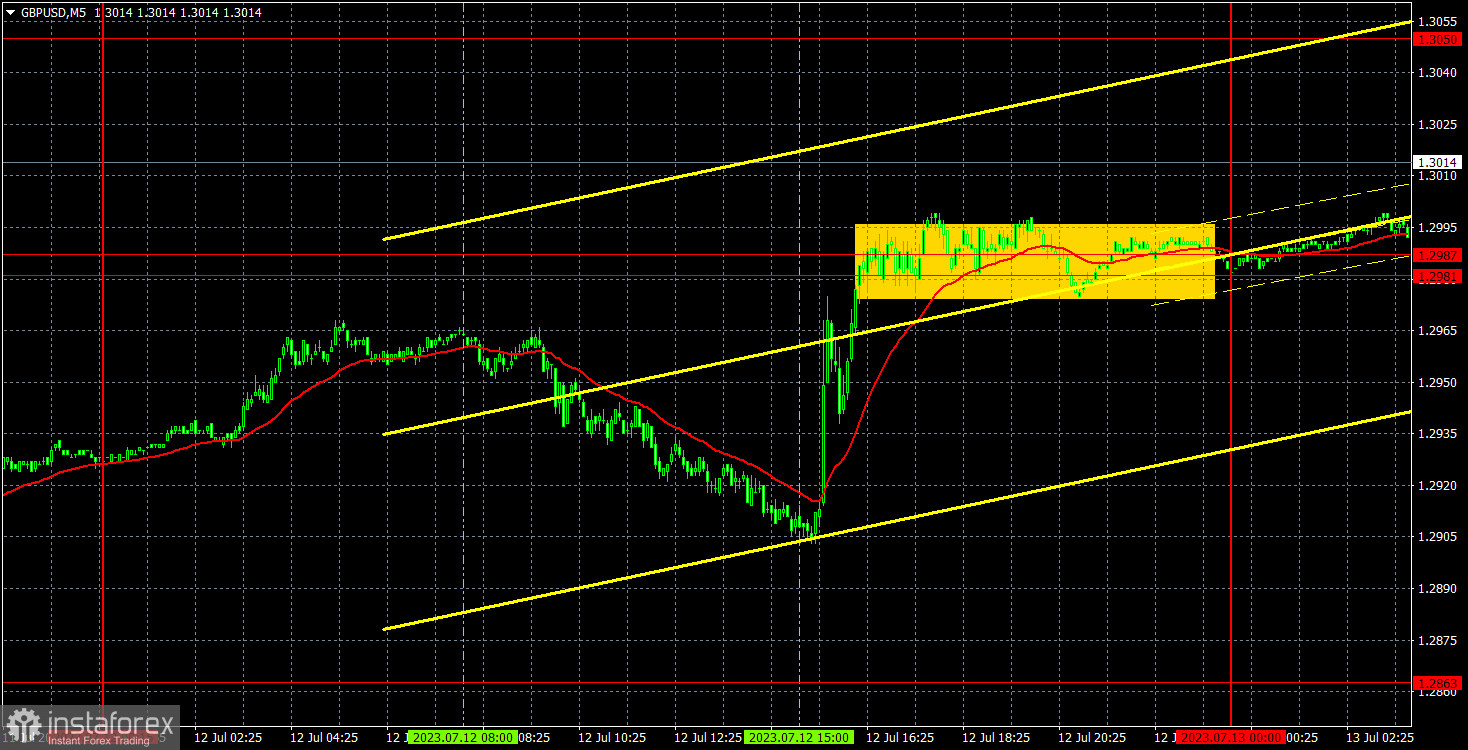
After a 2-day losing streak, the GBP/USD pair rose sharply on Wednesday. Nevertheless, during the day the pair managed to correct. Yet, the overall growth of the British currency turned out to be rather impressive. Yesterday, the fall of the US dollar occurred only due to the US inflation report. Despite the fact that the forecast was almost 100% correct, small deviations from it caused a new decrease in the US dollar. However, on Monday and Tuesday, the US currency also tumbled although there were no reasons for it. Yesterday we could have seen a climb in the US currency as traders factored in a strong slowdown in inflation a long time ago. However, the pair kept growing as speculators ignored macro stats. They prefer selling USD at any opportunity.
There were no trading signals yesterday. In the morning, the price lacked 15 pips to reach 1.2981 and give a sell signal. In the afternoon, there was no chance for a buy signal. As a result, only by the end of the day, the price entered the range of 1.2981-1.2987. However, traders did not pay attention to this entry point as the two main movements had already ended by that time.
COT report:
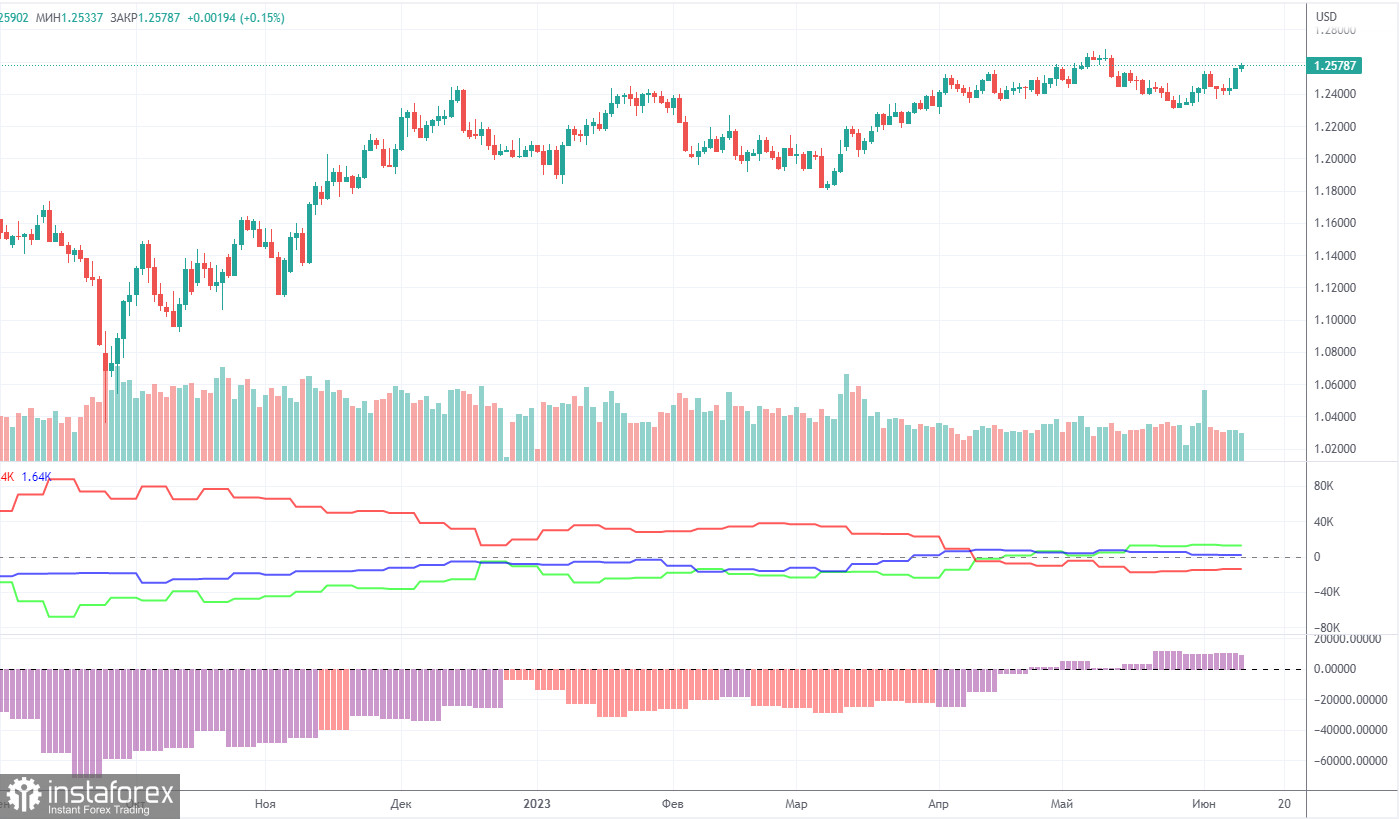
According to the latest report, the "Non-commercial" group of traders closed 7,900 long positions and 6,100 short ones. Thus, the net position of non-commercial traders decreased by 1,800 positions in a week but in general it continued to rise. The net position has been steadily growing over the past 10 months as well as the pound sterling. Now, the net position has advanced markedly. This is why the pair will hardly maintain its bullish momentum. I believe that a long and protracted downward movement should begin. COT reports signal a slight growth of the British currency but it will not be able to rise in the long term. There are no drivers for opening new long positions. However, there are no technical signals for short positions yet.
The British currency has already grown by 2,500 pips. Without a downward correction, the continuation of the uptrend will be illogical. The Non-commercial group of traders has opened 96,500 long positions and 46,100 short ones. Such a gap means the end of the uptrend. I remain skeptical about the long-term growth of the pound sterling but speculators continue to buy because the pair is growing. Usually, BTC shows such movements.
Analysis of GBP/USD 1H.
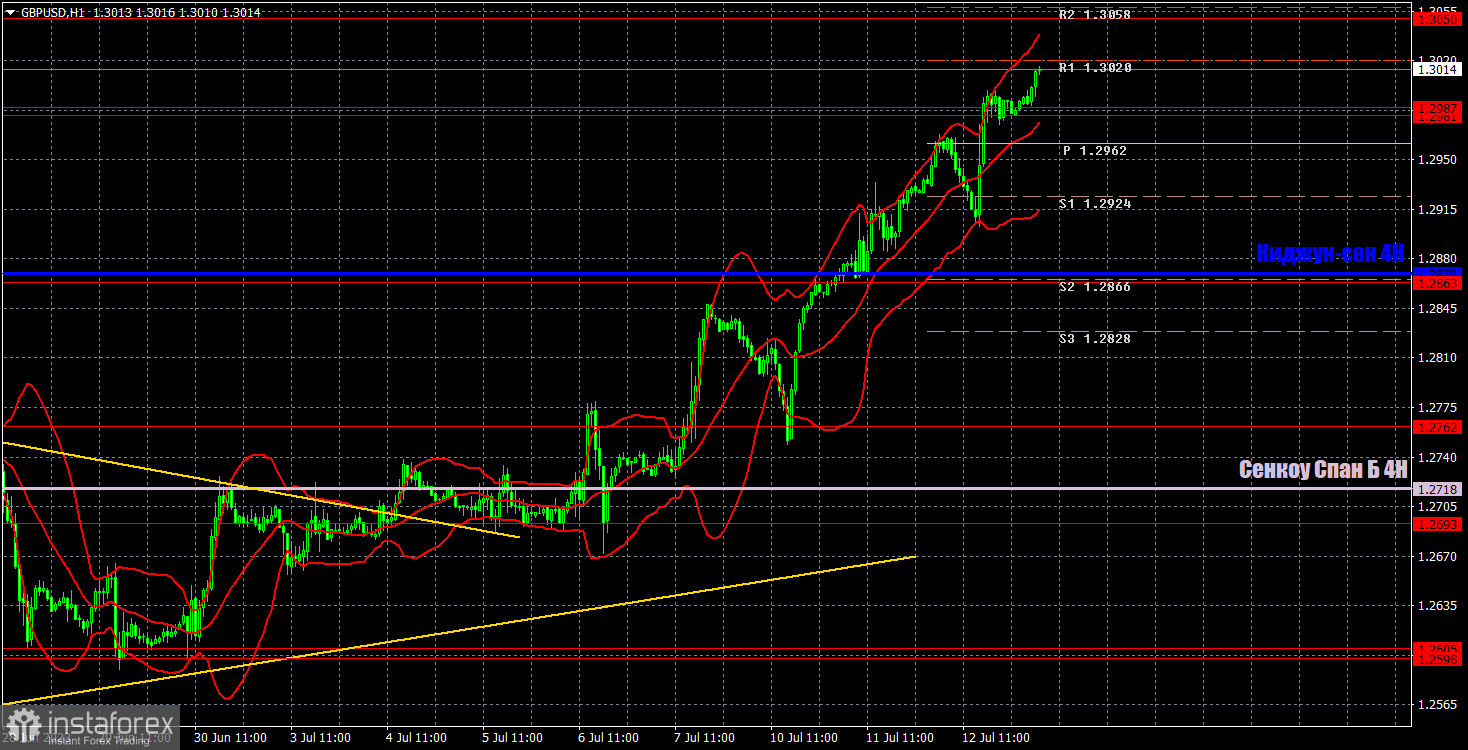
On the 1H timeframe, the pound/dollar pair maintains an upward trend. The ascending trend line indicates a further rise. So, traders are opening new long positions. However, the pound sterling is overbought. It is likely to decline in the medium term. Yet, it surpassed the descending trend line. Hence, it could move to new highs. According to the technical analysis, the pound sterling has drivers for a further increase.
On July 13, traders should pay attention to the following key levels: 1.2598-1.2605, 1.2693, 1.2762, 1.2863, 1.2981-1.2987, 1.3050, 1.3119, 1.3175, 1.3222. Senkou Span B (1.2718) and Kijun-sen (1.2870) lines can also provide signals, e.g. rebounds and breakout of these levels and lines. It is recommended to set the Stop Loss orders at the breakeven level when the price moves in the right direction by 20 pips. The lines of the Ichimoku indicator can move during the day, which should be taken into account when determining trading signals. There are support and resistance levels that can be used to lock in profits.
On Thursday, the UK will reveal monthly GDP and industrial production data. These reports are of the least importance. However, they could trigger a rise in the pound sterling. The US will publish the Producer Price Index and the initial jobless claims report. Traders still use every opportunity to buy the pair, ignoring bullish factors for the US dollar.
Description of chart:
Support and resistance levels are thick red lines near which the trend may end. They do not provide trading signals;The Kijun-sen and Senkou Span B lines are the lines of the Ichimoku indicator, plotted to the 1H timeframe from the 4H one. They provide trading signals;Extreme levels are thin red lines from which the price bounced earlier. They provide trading signals;Yellow lines are trend lines, trend channels, and any other technical patterns;Indicator 1 on the COT charts is the net position size for each category of traders;Indicator 2 on the COT charts is the net position size for the Non-commercial group.