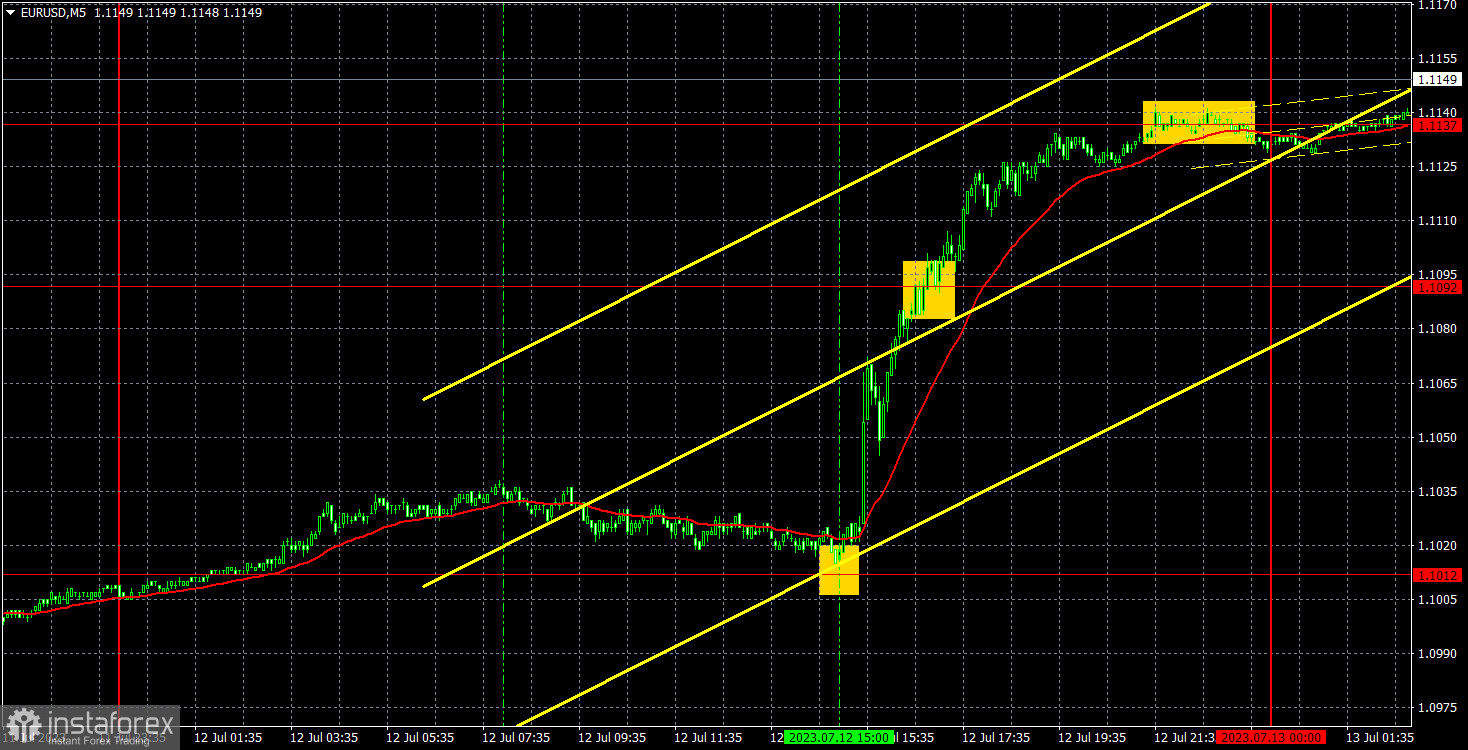
5M chart of EUR/USD
Fairly low levels of EUR/USD volatility on Wednesday.. until the release of the US inflation report. Afterwards, the dollar collapsed. Despite the fact that the market had been pricing in the US inflation report from the start of the week, which was supposed to register a sharp slowdown to 3.1%, even a minimal deviation from the forecast to the downside triggered an additional 100-point collapse of the US currency. And overnight, the sell-off of the dollar continued. If the currency depreciates even during Asian sessions, it means that the market has switched to total sell-off mode. There is basically nothing else to discuss. The US currency is falling again, too hard and illogically. The market spent three days pricing in one inflation report. Even Federal Reserve meetings have less influence on the pair's movement...
However, the trading signals were excellent. As soon as we saw a good trend, we were able to make a good profit. At the beginning of the US session, the pair bounced off the 1.1012 level, forming a buy signal. Since the inflation report was definitely not in favor of the dollar, you could open long positions (though there was still some degree of risk). But the risk was worth taking. The price subsequently reached the 1.1137 level, bringing traders about 110 points of profit.
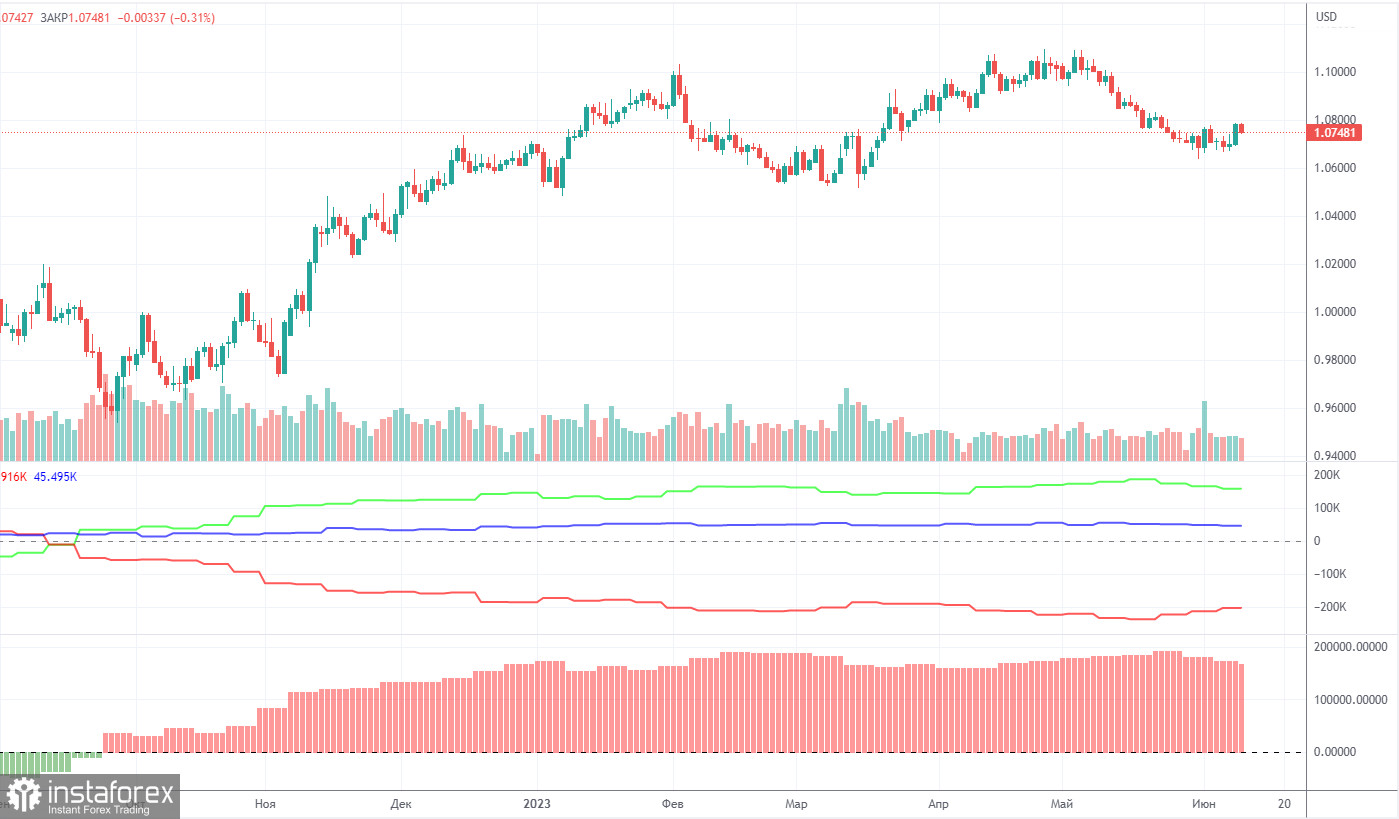
COT report:
On Friday, the new COT report for July 3 was released. Over the past 10 months, COT data has been in line with developments in the market. The net position of large traders (the second indicator on the chart) has been on the rise since September 2022. The euro started to show strength approximately at the same time. For the last 5 months, the net position is no longer growing, and the euro is not rising either. Currently, the net non-commercial position is bullish and keeps growing further. Meanwhile, the euro is still strong against the dollar.
We have repeatedly pointed out that a relatively high value of the net position suggests a potential end of the uptrend. This is shown by the first indicator, where the red and green lines have significantly diverged, which often precedes a trend reversal.
During the last reporting week, the number of long positions held by non-commercial traders decreased by 2,700 while the number of short positions fell by 500. As a result, the net position dropped by 2,200, which is very small. The number of long positions still exceeds the number of short ones by 143,000, an almost threefold gap. In principle, even without the COT reports, it's clear that the euro should fall, but the market is in no hurry to sell. Perhaps it fears a stronger increase in the ECB rate.
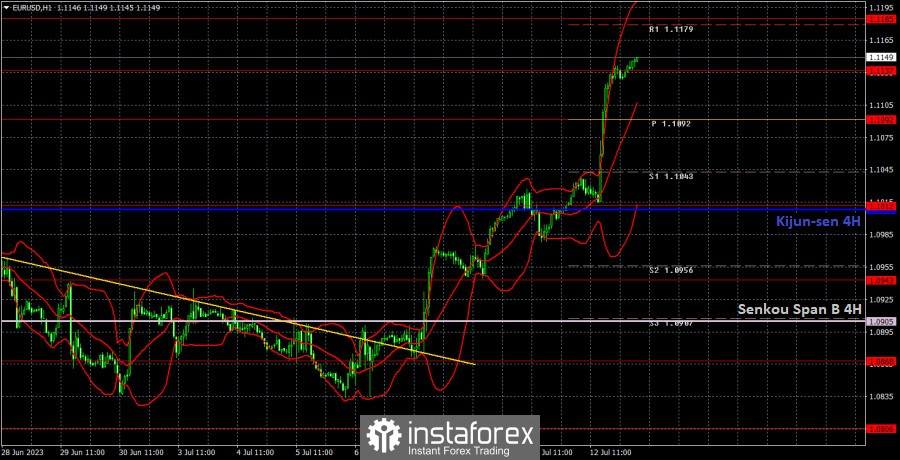
1H chart of EUR/USD
In the 1-hour chart, the pair extends its upward movement. If the euro had a reason to rise yesterday, and it was a stretch last Friday, then why did the dollar fall on Monday and Tuesday? It remains a mystery. We believe that the market has started a new stage of the US dollar sell-off, and its sentiment is only slightly affected by fundamentals and economic factors. In other words, if there had been no inflation report yesterday, the dollar would have still fallen.
On July 13, trading levels are seen at 1.0762, 1.0806, 1.0868, 1.0943, 1.1012, 1.1092, 1.1137, 1.1185, 1.1234, as well as the Senkou Span B (1.0905) and Kijun-sen (1.1008). Ichimoku indicator lines can move intraday, which should be taken into account when determining trading signals. There are also support and resistance although no signals are generated near these levels. Signals could be made when the price either breaks or bounces from these extreme levels. Do not forget to place a Stop Loss at the breakeven point when the price goes by 15 pips in the right direction. In case of a false breakout, it could save you from possible losses.
Today, the EU will release its industrial production report, and the US will publish the jobless claims data and the producer price index. These reports are just secondary of importance. Such data will only be capable of stirring some market reaction if the latest numbers significantly deviate from forecasts. Although what's the difference if the dollar is just falling every day anyway?
Indicators on charts:
Resistance/support - thick red lines, near which the trend may stop. They do not make trading signals.
Kijun-sen and Senkou Span B are the Ichimoku indicator lines moved to the hourly timeframe from the 4-hour timeframe. They are also strong lines.
Extreme levels are thin red lines, from which the price used to bounce earlier. They can produce trading signals.
Yellow lines are trend lines, trend channels, and other technical patterns.
Indicator 1 on the COT chart is the size of the net position of each trader category.
Indicator 2 on the COT chart is the size of the net position for the Non-commercial group of traders.