empty
 
 
11.10.2024 12:30 PM
Forecast for EUR/USD on October 11, 2024

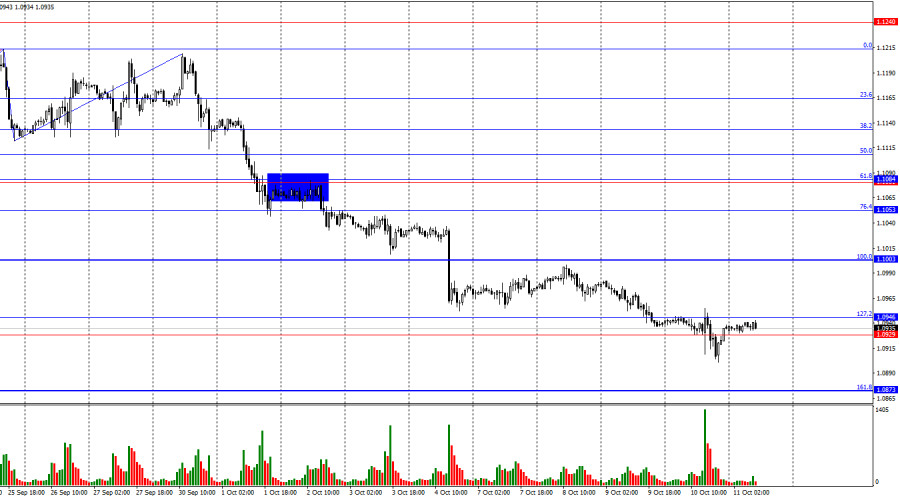
On Thursday, the EUR/USD pair continued its downward movement and consolidated below the support zone of 1.0929–1.0946. By Friday morning, the pair had returned to this zone and was likely to attempt a rebound today. Thus, the chances of further declines toward the 161.8% corrective level at 1.0873 remain high. Closing above the 1.0929–1.0946 zone could indicate a reversal in favor of the euro, leading to an upward movement toward the 100.0% Fibonacci level at 1.1003.

This image is no longer relevant

The wave situation has become a bit more complex but is overall clear in recent weeks. The last completed upward wave (September 25-30) did not break the peak of the previous wave, while the new downward wave (still forming) has broken the lows of the previous three waves. Therefore, a new bearish trend is forming. In the near term, we might see a corrective wave, but the bulls have lost their dominance in the market. Regaining control will require significant effort.

The news on Thursday again supported the bears. I say "again" because last week, nearly all economic data provided opportunities for bearish moves nearly every day. This week, there have been fewer reports, but the first significant one—U.S. inflation—supported the dollar. The Consumer Price Index (CPI) slowed to 2.4% in September, slightly above the expected 2.3%, while the core CPI rose unexpectedly, surprising the market. As a result, the market quickly abandoned expectations of a 50-basis-point rate cut by the FOMC in November. Now that traders anticipate a more "hawkish" monetary policy stance, the dollar gained strength yesterday and could continue to rise today. Although we haven't seen many corrections, this doesn't mean the dollar's rise won't continue. Additionally, it is worth noting that the ECB might lower rates by another 25 basis points in October. This is a move that traders were not expecting.

This image is no longer relevant

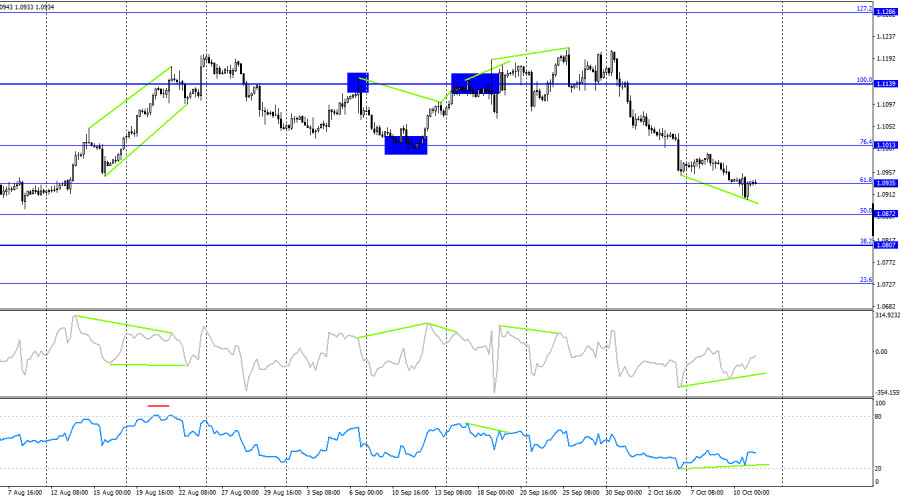
On the 4-hour chart, the pair turned in favor of the dollar following a series of bearish divergences on the RSI and CCI indicators. Currently, the pair has dropped to the 61.8% corrective level at 1.0935. A consolidation below this level could signal further declines toward the next Fibonacci level at 50.0%—1.0872. Both indicators are currently showing potential bullish divergences, but these only suggest the possibility of a correction, as the trend has turned bearish.

Commitments of Traders (COT) Report:

This image is no longer relevant

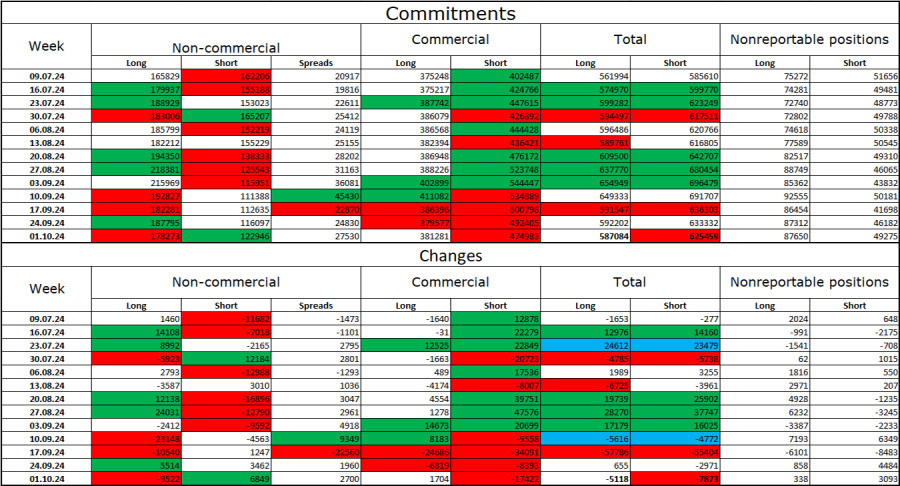
During the last reporting week, speculators closed 9,522 long positions and opened 6,849 short positions. The sentiment of the "Non-commercial" group turned bearish several months ago, but currently, the bulls are in control again. The total number of long positions held by speculators now stands at 178,000, while short positions are at 123,000.

However, for the fourth consecutive week, large players have been reducing their positions in the euro. In my view, this could signal the beginning of a new bearish trend, or at least a correction. The main factor for the dollar's decline—the expectation of FOMC easing—has already played out, leaving the dollar with fewer reasons to fall. More reasons may emerge over time, but for now, further strengthening of the U.S. dollar seems more likely. Technical analysis also indicates the formation of a bearish trend. Therefore, I am preparing for a prolonged decline in the EUR/USD pair.

News Calendar for the U.S. and the Eurozone:

  • U.S.: Producer Price Index (12:30 UTC).
  • U.S.: University of Michigan Consumer Sentiment Index (14:00 UTC).

On October 11, the economic calendar includes two more significant events. While they may not be as critical as the inflation report, traders' reactions could still be strong.

Forecast for EUR/USD and Trading Tips:

Selling the pair was possible upon a close below the 1.1139 level on the 4-hour chart, with targets at 1.1081, 1.1070, 1.1013, and 1.0984. All targets have been reached. A consolidation below the 1.0929 level would allow for new short positions with a target of 1.0873. I would consider buying the pair after a rebound from the 1.0873 level.

Fibonacci levels are plotted between 1.1003–1.1214 on the hourly chart and 1.1139–1.0603 on the 4-hour chart.

Samir Klishi,
ইন্সটাফরেক্সের বিশ্লেষণ বিশেষজ্ঞ
© 2007-2024
ইনস্টাফরেক্স দিয়ে ক্রিপ্টোমুদ্রা দর পরিবর্তনে আয় করুন।
মেটাট্রেডার 4 ডাউনলোড করে আপনার প্রথম ট্রেড চালু করুন।
  • Grand Choice
    Contest by
    InstaForex
    InstaForex always strives to help you
    fulfill your biggest dreams.
    প্রতিযোগীতায় অংশগ্রহণ করুন
  • চ্যান্সি ডিপোজিট
    আপনার অ্যাকাউন্টে $3,000 জমা করুন এবং $1000 এর অধিক নিন!
    চ্যান্সি ডিপোজিট প্রচারাভিযানে আমরা অক্টোবর $1000 লটারি করেছি! একটি ট্রেডিং অ্যাকাউন্টে $3,000 জমা করে এই অর্থ জেতার একটি সুযোগ নিন! এই শর্ত পূরণ করে, আপনি একজন অংশগ্রহণকারী হতে পারবেন।
    প্রতিযোগীতায় অংশগ্রহণ করুন
  • বুদ্ধিমত্তার সাথে ট্রেড করুন, ডিভাইস জিতুন
    আপনার অ্যাকাউন্টে কমপক্ষে $৫০০ টপ আপ করুন, প্রতিযোগিতার জন্য সাইন আপ করুন এবং মোবাইল ডিভাইস জেতার সুযোগ পান।
    প্রতিযোগীতায় অংশগ্রহণ করুন
  • ১০০% বোনাস
    আপনার ডিপোজিটের উপর ১০০% বোনাস পাওয়ার অনন্য সুযোগ
    বোনাস পান
  • ৫৫% বোনাস
    আপনার অ্যাকাউন্টে প্রতিটি ডিপোজিটের উপর ৫৫% বোনাসের জন্য আবেদন করুন
    বোনাস পান
  • ৩০% বোনাস
    প্রতিবার আপনার অ্যাকাউন্ট টপ আপ করার সময় ৩০% বোনাস নিন
    বোনাস পান

সুপারিশকৃত নিবন্ধ

এখন কথা বলতে পারবেন না?
আপনার প্রশ্ন জিজ্ঞাসা করুন চ্যাট.
Widget callback