empty
 
 
07.10.2024 02:40 PM
EUR/USD. October 7th. Prospects Are Opening Up for the Dollar

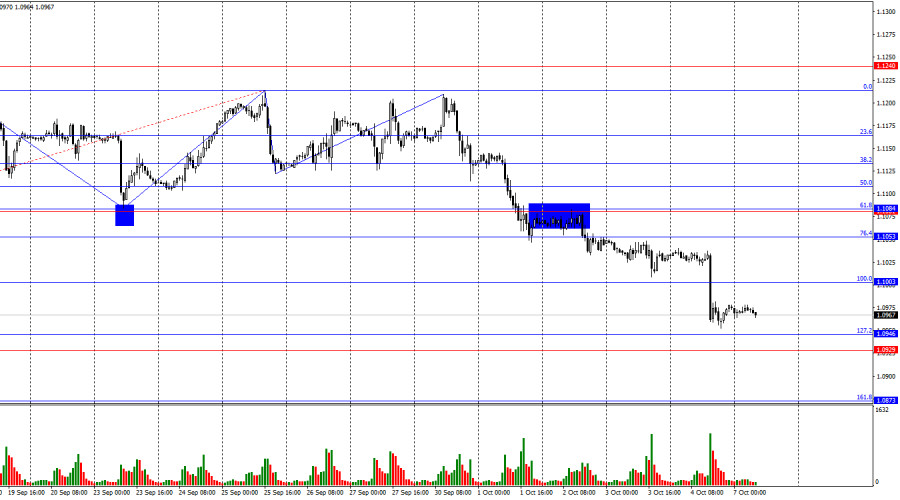
The EUR/USD pair continued its downward trend on Friday and consolidated below the 100.0% Fibonacci retracement level at 1.1003 according to the new Fibonacci level grid. Thus, the decline may continue toward the next Fibonacci retracement level of 127.2% at 1.0946. A rebound of the pair from either this level or the support zone of 1.0929–1.0946 will favor the euro and signal a potential rise. Consolidation below this zone will increase the likelihood of a continuation downward toward the next Fibonacci level of 161.8% at 1.0873.

This image is no longer relevant

The wave situation has become more complex in recent weeks, but overall, it raises no questions. The last completed upward wave (September 25-30) did not break the peak of the previous wave, while the new downward wave has easily breached the lows of the previous three waves. Thus, the pair has begun forming a new "bearish" trend. In the near future, we may see a corrective wave, but the bulls have lost the initiative.

The information background on Friday again allowed bears to continue their active actions in the market, and they did so. The Nonfarm Payrolls report exceeded traders' expectations for the first time in six months, allowing the dollar to continue its rise. The unemployment rate unexpectedly dropped to 4.1%, which also supported bearish traders. However, Friday's statistics are a double-edged sword. Strong statistics are a positive factor for the U.S. dollar, but the issues of inflation and the Federal Reserve's monetary policy remain unresolved. Inflation in America continues to decline and may slow down to 2.3% this week. In light of this, the FOMC may lower the rate by another 0.50% at the next meeting, which could cool the bears' enthusiasm. The trend is forming into a "bearish" one, but we could also see deep corrections against a backdrop of more dovish developments regarding the FOMC's rate. The inflation report may also provoke a retreat from bears.

This image is no longer relevant

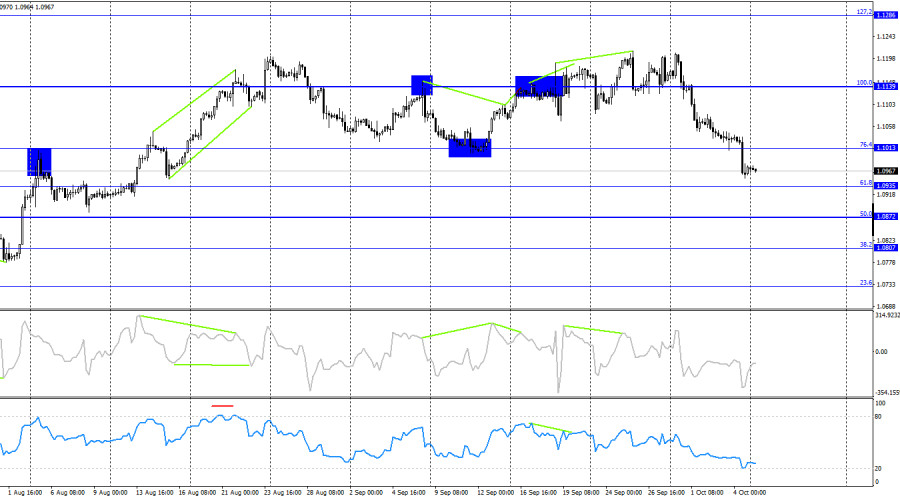
On the 4-hour chart, the pair made a reversal in favor of the U.S. dollar after forming a series of "bearish" divergences in the RSI and CCI indicators. The RSI also entered the overbought zone several weeks ago. Consolidation below the level of 1.1013 allows for the continuation of the decline toward the levels of 1.0935 and 1.0872. No new emerging divergences are observed today in any indicator.

Commitments of Traders (COT) Report:

This image is no longer relevant

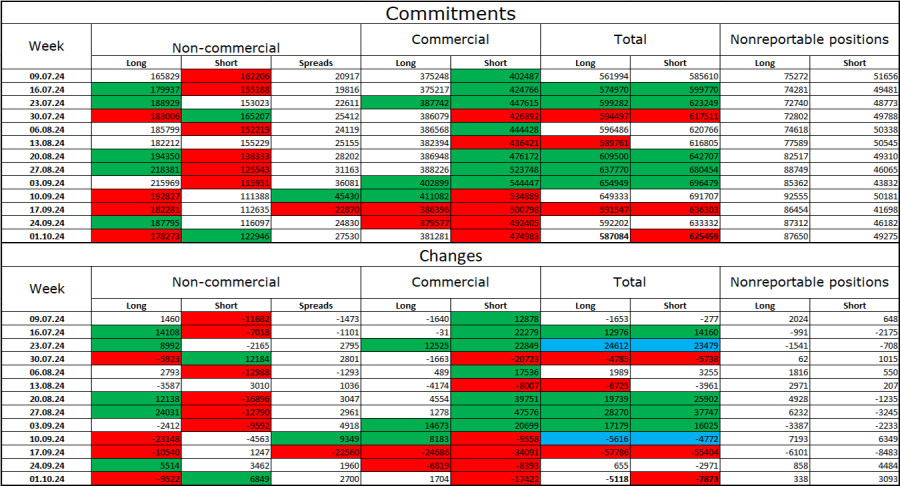
During the last reporting week, speculators closed 9,522 long positions and opened 6,849 short positions. The sentiment of the "Non-commercial" group turned "bearish" several months ago, but currently, bulls are regaining dominance. The total number of long positions held by speculators now stands at 178,000, while short positions total only 123,000.

However, for the fourth consecutive week, large players have largely been getting rid of the euro. In my view, this could herald a new "bearish" trend or at least a correction. The key factor behind the dollar's decline—expectations of FOMC easing—has been priced in; the dollar has no more reasons to fall. These reasons may arise over time, but right now, the rise of the U.S. dollar seems more likely. Technical analysis also indicates the beginning of a "bearish" trend. Thus, I am preparing for a prolonged decline in the EUR/USD pair.

News Calendar for the US and EU:

EU - Retail Sales Change (09:00 UTC).

On October 7, the economic events calendar contains only one entry of medium significance. The impact of the information background on traders' sentiment may be weak today.

Forecast for EUR/USD and Trader Advice:

Sales of the pair were possible upon closing below the level of 1.1139 on the 4-hour chart with targets at 1.1081, 1.1070, 1.1013, and 1.0984. All targets have been reached. I wouldn't rush into new sales. Buying the pair may be possible today if there is a rebound on the hourly chart from the support zone of 1.0929–1.0946 with targets at 1.1003 and 1.1053.

Fibonacci level grids are constructed from 1.1003–1.1214 on the hourly chart and from 1.1139–1.0603 on the 4-hour chart.

Samir Klishi,
ইন্সটাফরেক্সের বিশ্লেষণ বিশেষজ্ঞ
© 2007-2024
ইনস্টাফরেক্স দিয়ে ক্রিপ্টোমুদ্রা দর পরিবর্তনে আয় করুন।
মেটাট্রেডার 4 ডাউনলোড করে আপনার প্রথম ট্রেড চালু করুন।
  • Grand Choice
    Contest by
    InstaForex
    InstaForex always strives to help you
    fulfill your biggest dreams.
    প্রতিযোগীতায় অংশগ্রহণ করুন
  • চ্যান্সি ডিপোজিট
    আপনার অ্যাকাউন্টে $3,000 জমা করুন এবং $5000 এর অধিক নিন!
    চ্যান্সি ডিপোজিট প্রচারাভিযানে আমরা নভেম্বর $5000 লটারি করেছি! একটি ট্রেডিং অ্যাকাউন্টে $3,000 জমা করে এই অর্থ জেতার একটি সুযোগ নিন! এই শর্ত পূরণ করে, আপনি একজন অংশগ্রহণকারী হতে পারবেন।
    প্রতিযোগীতায় অংশগ্রহণ করুন
  • বুদ্ধিমত্তার সাথে ট্রেড করুন, ডিভাইস জিতুন
    আপনার অ্যাকাউন্টে কমপক্ষে $৫০০ টপ আপ করুন, প্রতিযোগিতার জন্য সাইন আপ করুন এবং মোবাইল ডিভাইস জেতার সুযোগ পান।
    প্রতিযোগীতায় অংশগ্রহণ করুন
  • ১০০% বোনাস
    আপনার ডিপোজিটের উপর ১০০% বোনাস পাওয়ার অনন্য সুযোগ
    বোনাস পান
  • ৫৫% বোনাস
    আপনার অ্যাকাউন্টে প্রতিটি ডিপোজিটের উপর ৫৫% বোনাসের জন্য আবেদন করুন
    বোনাস পান
  • ৩০% বোনাস
    প্রতিবার আপনার অ্যাকাউন্ট টপ আপ করার সময় ৩০% বোনাস নিন
    বোনাস পান

সুপারিশকৃত নিবন্ধ

এখন কথা বলতে পারবেন না?
আপনার প্রশ্ন জিজ্ঞাসা করুন চ্যাট.
Widget callback