empty
04.01.2022 04:27 AM
Forecast and trading signals for EUR/USD for January 4. Detailed analysis of the pair's movement and trade deals. A good start to the year for the euro and the US dollar

EUR/USD 5M

This image is no longer relevant

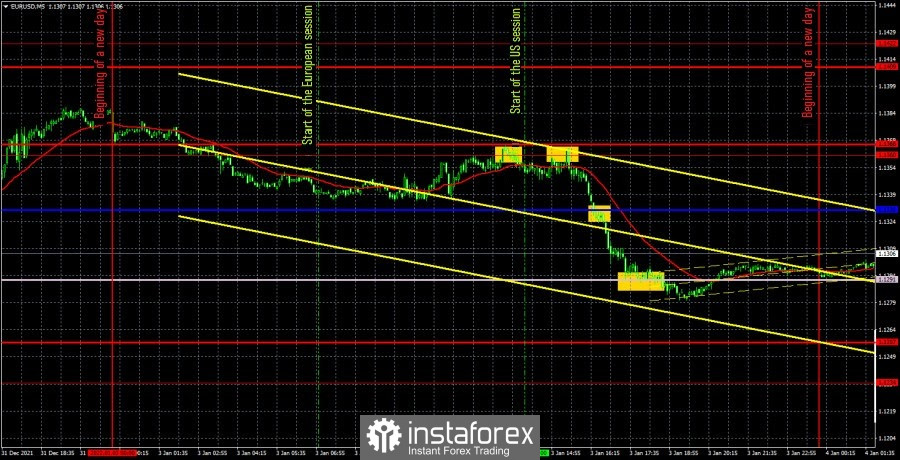
The EUR/USD pair was trading quite actively during the first trading day of the week, especially for the 5-minute timeframe. The volatility of the day was more than 100 points, so it was possible and necessary to trade the pair. It turns out that the year began immediately with active movement, without long swaying. Quite good signals were generated in the same way. However, before we start examining them, it should be noted that important macroeconomic statistics were not published on Monday, either in the US or in the European Union. There were only indices of business activity in the manufacturing sectors of both countries, which, however, did not cause any reaction from traders. And it is not surprising that their values practically did not differ from the predicted ones. Thus, on January 3, traders could only trade using technical signals. The movement was rather weak during the European trading session. The bears did not manage to push the pair to the critical line, so no buy signal was formed. But bulls were able to reach the extremum level of 1.1360 (formerly 1.1355) and failed to overcome it twice. The pair bounced off this level twice, forming sell signals. Traders could open short positions in both cases, but duplication, of course, was not worth it. Those who opened positions after the first signal after the second should not have done it. As a result, the pair began a rather powerful fall in the US trading session and by the end of the day found itself near the Senkou Span B line, which by that time was at the level of 1.1291. On the way, the Kijun-sen line was crossed, near which another sell signal was formed. But traders just had to stay in short positions here. Thus, in the late afternoon, this single deal should have been closed. There was no clear rebound from the Senkou Span B line, so the shorts had to be manually eliminated. The profit was about 55 points. Nice start to the year.

We recommend you to familiarize yourself:

Overview of the EUR/USD pair. December 31. Traders started preparing for the New Year back in November.

Overview of the GBP/USD pair. December 31. The pound is waiting for another fun year.

Forecast and trading signals for GBP/USD for December 31. Detailed analysis of the movement of the pair and trade deals.

EUR/USD 1H

This image is no longer relevant

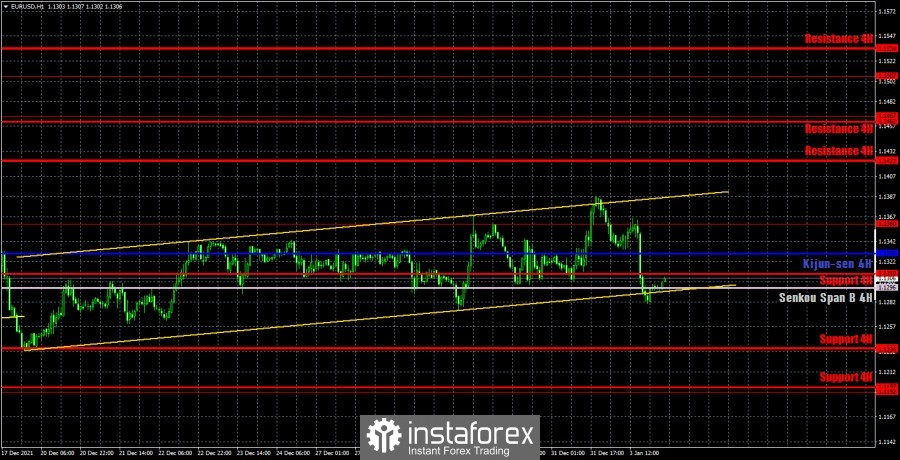
An upward trend channel was formed on the hourly timeframe on the last day of the outgoing year. It has a very formal meaning, since in the last month the pair was more within the 1.1234-1.1355 horizontal channel. But still, at the end of the year, the pair managed to gain a foothold slightly above the level of 1.1355, so now a marginal upward trend has formed, which can be broken today, since the pair managed to fall by 80 points on the first trading day of 2022. In general, only a rebound from the Senkou Span B line and the lower border of this channel can save the euro from the beginning of a new downward trend. We highlight the following levels for trading on Tuesday - 1.1192, 1.1234, 1.1360, 1.1422, as well as the Senkou Span B (1.1296) and Kijun-sen (1.1330) lines. The Ichimoku indicator lines can change their position during the day, which should be taken into account when looking for trading signals. Signals can be "rebounds" and "breakthroughs" of these levels and lines. Do not forget about placing a Stop Loss order at breakeven if the price moves 15 points in the right direction. This will protect you against possible losses if the signal turns out to be false. Today, the United States will publish the index of business activity in the ISM manufacturing sector for December. This is not the most significant indicator, but it can still provoke some movement in the pair. Traders are now showing that they are ready to trade without a "foundation" and "macroeconomics".

Explanations for the chart:

Support and Resistance Levels are the levels that serve as targets when buying or selling the pair. You can place Take Profit near these levels.

Kijun-sen and Senkou Span B lines are lines of the Ichimoku indicator transferred to the hourly timeframe from the 4-hour one.

Support and resistance areas are areas from which the price has repeatedly rebounded off.

Yellow lines are trend lines, trend channels and any other technical patterns.

Indicator 1 on the COT charts is the size of the net position of each category of traders.

Indicator 2 on the COT charts is the size of the net position for the non-commercial group.

Paolo Greco,
ইন্সটাফরেক্সের বিশ্লেষণ বিশেষজ্ঞ
© 2007-2025
টাইমফ্রেম নির্বাচন করুন
5
মিনিট
15
মিনিট
30
মিনিট
1
ঘন্টা
4
ঘন্টা
1
দিন
1
সপ্তাহ
ইনস্টাফরেক্স দিয়ে ক্রিপ্টোমুদ্রা দর পরিবর্তনে আয় করুন।
মেটাট্রেডার 4 ডাউনলোড করে আপনার প্রথম ট্রেড চালু করুন।
  • Grand Choice
    Contest by
    InstaForex
    InstaForex always strives to help you
    fulfill your biggest dreams.
    প্রতিযোগীতায় অংশগ্রহণ করুন

সুপারিশকৃত নিবন্ধ

১৯ মার্চ কীভাবে GBP/USD পেয়ারের ট্রেডিং করবেন? নতুন ট্রেডারদের জন্য সহজ পরামর্শ ও ট্রেডিংয়ের বিশ্লেষণ

মঙ্গলবারের ট্রেডের বিশ্লেষণ GBP/USD পেয়ারের 1H চার্ট মঙ্গলবার, GBP/USD পেয়ারের মুভমেন্টের সাথে EUR/USD পেয়ারের মূল্যের মুভমেন্টের ঘনিষ্ঠভাবে মিল ছিল। ব্রিটিশ পাউন্ড প্রায়ই ইউরোর পথ অনুসরণ করে, এবং কিছু ক্ষেত্রে এটি

Paolo Greco 07:52 2025-03-19 UTC+2

১৯ মার্চ কীভাবে EUR/USD পেয়ারের ট্রেডিং করবেন? নতুন ট্রেডারদের জন্য সহজ পরামর্শ ও ট্রেডিংয়ের বিশ্লেষণ

মঙ্গলবারের ট্রেডের বিশ্লেষণ EUR/USD পেয়ারের 1H চার্ট মঙ্গলবার, EUR/USD কারেন্সি পেয়ারের মূল্য আবারও ঊর্ধ্বমুখী হওয়ার প্রবণতা দেখিয়েছে। দৈনিক মুভমেন্ট বিশ্লেষণ করলে দেখা যাচ্ছে যে, এই পেয়ারের মূল্য প্রথমে বৃদ্ধি পেয়েছে

Paolo Greco 07:35 2025-03-19 UTC+2

১৮ মার্চ কীভাবে GBP/USD পেয়ারের ট্রেডিং করবেন? নতুন ট্রেডারদের জন্য সহজ পরামর্শ ও ট্রেডিংয়ের বিশ্লেষণ

সোমবার, পুনরায় GBP/USD পেয়ারের মূল্যের ঊর্ধ্বমুখী প্রবণতা শুরু করার চেষ্টা করা হয়েছিল এবং ঘণ্টাভিত্তিক টাইমফ্রেমে এই পেয়ারের মূল্য বর্তমান ঊর্ধ্বমুখী প্রবণতার সময় পরিলক্ষিত সর্বশেষ স্থানীয় সর্বোচ্চ লেভেল ব্রেক করতে সক্ষম

Paolo Greco 07:19 2025-03-18 UTC+2

১৮ মার্চ কীভাবে EUR/USD পেয়ারের ট্রেডিং করবেন? নতুন ট্রেডারদের জন্য সহজ পরামর্শ ও ট্রেডিংয়ের বিশ্লেষণ

সোমবারের ট্রেডের বিশ্লেষণ EUR/USD পেয়ারের 1H চার্ট সোমবার, EUR/USD কারেন্সি পেয়ারের মূল্যের ঊর্ধ্বমুখী প্রবণতা পুনরায় শুরু হয়েছিল, তবে মূল্য এখনো 1.0804 এবং 1.0952 লেভেলের মধ্যে অবস্থিত সাইডওয়েজ চ্যানেলের মধ্যে রয়েছে।

Paolo Greco 07:01 2025-03-18 UTC+2

১৭ মার্চ কীভাবে GBP/USD পেয়ারের ট্রেডিং করবেন? নতুন ট্রেডারদের জন্য সহজ পরামর্শ ও ট্রেডিংয়ের বিশ্লেষণ

শুক্রবারের ট্রেডের বিশ্লেষণ GBP/USD পেয়ারের 1H চার্ট শুক্রবার, স্বল্প মাত্রার অস্থিরতা সাথে GBP/USD কারেন্সি পেয়ারের ট্রেড করা হচ্ছে এবং মূল্য 1.2913 থেকে 1.2980 রেঞ্জের সাইডওয়েজ চ্যানেলের মধ্যে অবস্থান করেছে।

Paolo Greco 06:12 2025-03-17 UTC+2

১৭ মার্চ কীভাবে EUR/USD পেয়ারের ট্রেডিং করবেন? নতুন ট্রেডারদের জন্য সহজ পরামর্শ ও ট্রেডিংয়ের বিশ্লেষণ

শুক্রবারের ট্রেডের বিশ্লেষণ EUR/USD পেয়ারের 1H চার্ট শুক্রবার, EUR/USD কারেন্সি পেয়ারের মূল্য স্বল্প সময়ের জন্য ঊর্ধ্বমুখী হয়েছিল; তবে, এই বৃদ্ধি দীর্ঘস্থায়ী ছিল না এবং বিশেষভাবে শক্তিশালীও ছিল না। ইউরোপীয় ট্রেডিং

Paolo Greco 05:53 2025-03-17 UTC+2

১৪ মার্চ কীভাবে GBP/USD পেয়ারের ট্রেডিং করবেন? নতুন ট্রেডারদের জন্য সহজ পরামর্শ ও ট্রেডিংয়ের বিশ্লেষণ

বৃহস্পতিবারের ট্রেডের বিশ্লেষণ GBP/USD পেয়ারের 1H চার্ট বৃহস্পতিবার, GBP/USD পেয়ারের মূল্য সামান্য হ্রাস পেয়েছিল, তবে মূল্য খুব সংকীর্ণ একটি রেঞ্জের মধ্যে রয়ে গেছে, যা একটি সাইডওয়েজ চ্যানেলের মতো মনে হচ্ছে।

Paolo Greco 07:46 2025-03-14 UTC+2

১৪ মার্চ কীভাবে EUR/USD পেয়ারের ট্রেডিং করবেন? নতুন ট্রেডারদের জন্য সহজ পরামর্শ ও ট্রেডিংয়ের বিশ্লেষণ

বৃহস্পতিবার, EUR/USD কারেন্সি পেয়ারের মূল্যের নিম্নমুখী প্রবণতা অব্যাহত ছিল, যা এক সপ্তাহেরও বেশি সময় ধরে চলমান ঊর্ধ্বমুখী মুভমেন্টের পর দেখা গেছে, যা মূলত ডোনাল্ড ট্রাম্প সম্পর্কিত ঘটনাগুলোর দ্বারা চালিত হয়েছিল।

Paolo Greco 07:33 2025-03-14 UTC+2
এখন কথা বলতে পারবেন না?
আপনার প্রশ্ন জিজ্ঞাসা করুন চ্যাট.
Widget callback
 

Dear visitor,

Your IP address shows that you are currently located in the USA. If you are a resident of the United States, you are prohibited from using the services of InstaFintech Group including online trading, online transfers, deposit/withdrawal of funds, etc.

If you think you are seeing this message by mistake and your location is not the US, kindly proceed to the website. Otherwise, you must leave the website in order to comply with government restrictions.

Why does your IP address show your location as the USA?

  • - you are using a VPN provided by a hosting company based in the United States;
  • - your IP does not have proper WHOIS records;
  • - an error occurred in the WHOIS geolocation database.

Please confirm whether you are a US resident or not by clicking the relevant button below. If you choose the wrong option, being a US resident, you will not be able to open an account with InstaForex anyway.

We are sorry for any inconvenience caused by this message.