EUR/USD 5M
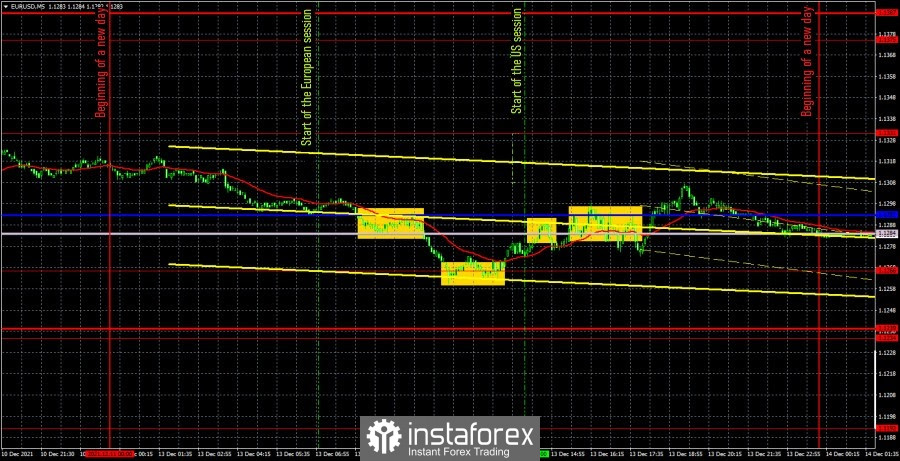
The EUR/USD pair began a new round of downward movement on Monday. Earlier, we have already said that the bulls for the euro/dollar pair are extremely weak at this time, and the markets in general do not want to risk before the European Central Bank and Federal Reserve meetings and actively trade the pair. There was not a single major macroeconomic report or other event on Monday that could trigger a strong, trending move. Nevertheless, the pair did not stand still, and the volatility of the day was just over 60 points. The price passed about half of this distance during the Asian trading session. But in the European and US sessions, the volatility was 40 points. And with such volatility, it is quite difficult to rely on strong trading signals and profitable trading. Nevertheless, several trading signals were generated during the day. However, before we begin to analyze them, it should be noted right away that all the lines of the Ichimoku indicator and the levels that were worked out during the day were very close to each other. The maximum distance between them was 18 points. Therefore, most of the trading signals should have been filtered by this factor alone. For example, the first sell signal when the price has broken both lines of the Ichimoku indicator. At the time of the signal formation, the pair was already at the level of 1.1278. That is, the maximum profit on a short position that could have been 5-6 points, taking into account the rebound from the level of 1.1266, which eventually took place. Thus, the first signal to sell and the second to buy could be worked out, but they could bring a maximum of 10 points of profit. All signals from the US trading session should be ignored, since the price simply began to "dance" around the Kijun-sen and Senkou Span B lines, and after the European session it was already clear that the movement would be as flat as possible. As a result, the day was completed with a minimal profit.
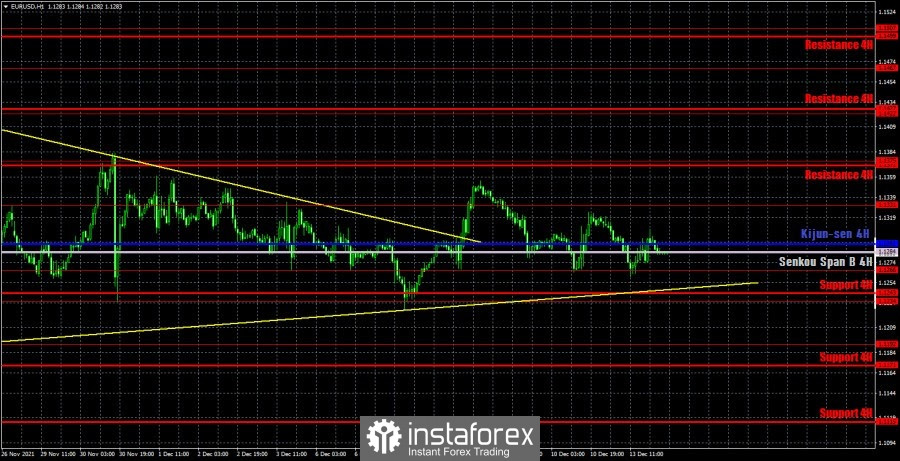
EUR/USD 1H

On the hourly timeframe, the pair maintains a new upward trend with great difficulty, but, as we can see, quotes are in no hurry to go up. In recent days, there has been more flat than a trend. And what will happen after Wednesday, in general, it is quite difficult to imagine now. The uptrend line is very weak and it will not be difficult to overcome it. On Tuesday, we highlight the following levels for trading - 1.1192, 1.1234, 1.1266, 1.1331, 1.1375, as well as the Senkou Span B (1.1284) and Kijun-sen (1.192) lines. The Ichimoku indicator lines can change their position during the day, which should be taken into account when looking for trading signals. Signals can be rebounds or breakthroughs of these levels and lines. Do not forget about placing a Stop Loss order at breakeven if the price moves 15 points in the right direction. This will protect you against possible losses if the signal turns out to be false. The European Union will publish a report on industrial production on December 14, and in the US - the producer price index. Both reports are absolutely secondary in the current conditions and the market reaction to them with a 90% probability will not follow. This means that today there may again be low volatility and the absence of a trend.
We recommend you to familiarize yourself:
Overview of the EUR/USD pair. December 14. What if the Fed raises rates on Wednesday?
Overview of the GBP/USD pair. December 14. Here's how: the European Union may start another legal procedure against the UK over the "fish" issue.
Forecast and trading signals for GBP/USD for December 14. Detailed analysis of the movement of the pair and trade deals.
Analysis of the COT report
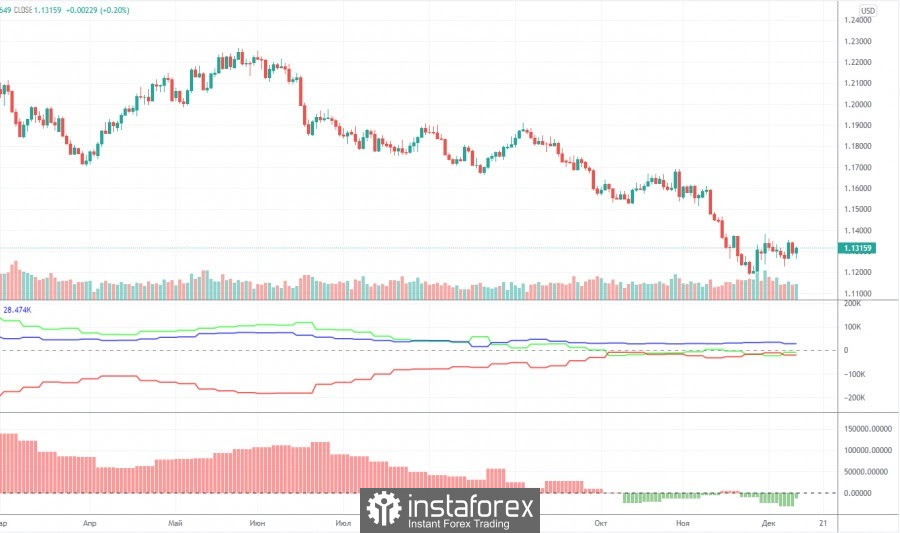
The mood of non-commercial traders became... less bearish again during the last reporting week (November 30 – December 6). What does it mean? This means that the group of "non-commercial" traders now has more open short positions than long ones, but at the same time, the number of sell contracts (shorts) has decreased over the past week. To be precise, it decreased by 15,000, and the number of longs increased by 2,000. Thus, the net position of professional players increased by 17,000, respectively, the bearish mood became less strong. However, it was not strong, and the trend is important to us first of all. And that's just with the trend lately, everything is bad... The fact is (and it is perfectly noticeable in the chart above) that the green and red lines (net positions of non-commercial and commercial traders) have been tightly stuck near the zero level in recent months. This means that now the mood of both groups of traders is as neutral as possible. Nevertheless, all this time the European currency continues to fall, which already looks like a correlation between the actions of major market participants and the movement of the euro exchange rate. So far, this can be attributed to chance, but the bearish mood in the euro has not intensified in recent weeks and months. Thus, it is impossible to say that major players continue to get rid of the euro currency. From this point of view, it can be assumed that the downward trend is nearing its end, but at the same time you should wait for strong technical signals to start opening long positions.
Explanations for the chart:
Support and Resistance Levels are the levels that serve as targets when buying or selling the pair. You can place Take Profit near these levels.
Kijun-sen and Senkou Span B lines are lines of the Ichimoku indicator transferred to the hourly timeframe from the 4-hour one.
Support and resistance areas are areas from which the price has repeatedly rebounded off.
Yellow lines are trend lines, trend channels and any other technical patterns.
Indicator 1 on the COT charts is the size of the net position of each category of traders.
Indicator 2 on the COT charts is the size of the net position for the non-commercial group.