empty
 
 
09.11.2023 10:57 AM
EUR/USD and GBP/USD: Trading plan for beginner traders on November 9, 2023

Details of the Economic Calendar on November 8

The volume of retail sales in the EU decreased by 0.3% on a monthly basis and by 2.9% annually in September. Based on the available macroeconomic data, it can be assumed that the European Union is steadily sliding into a recession.

Analysis of Trading Charts from November 8

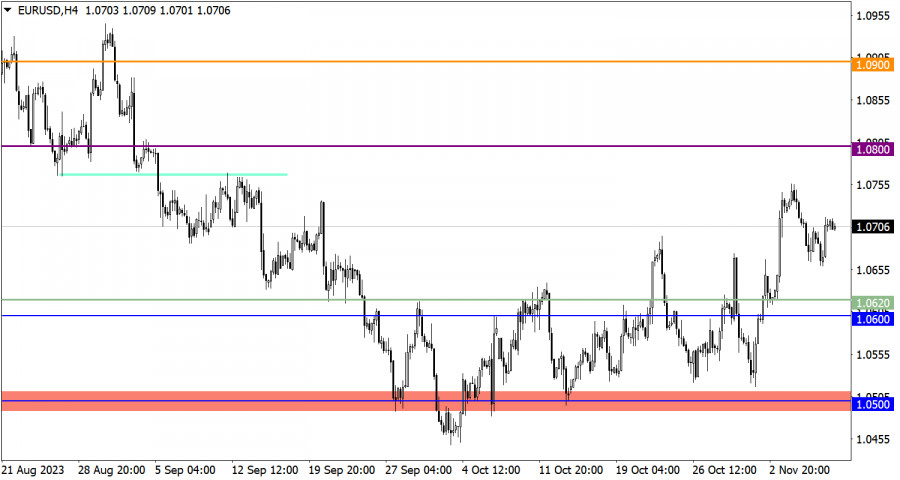
The EUR/USD currency pair locally displayed an upward trend, leading to a reversal above the 1.0700 mark.

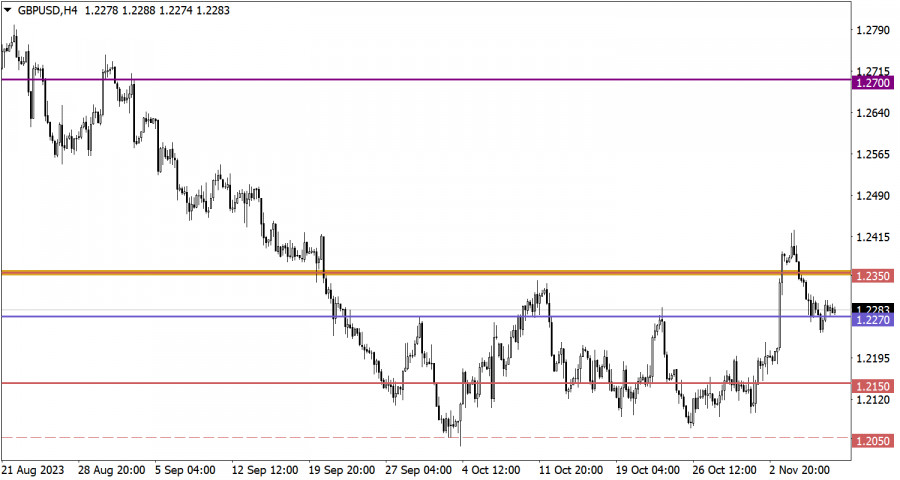
The GBP/USD pair partially regained positions relative to the recent decline. As a result, the quote returned above the 1.2270 mark, while the overall downward trend persists in the market.

This image is no longer relevant

Economic Calendar on November 9

Today, data on U.S. jobless claims is expected, with an expected overall increase in their forecasted figure. Details of statistical data indicate that the volume of continuing claims may rise from 1.818 million to 1.820 million, and the volume of initial claims may rise from 217k to 218k.

Time targeting:

U.S. Jobless Claims – 13:30 UTC

EUR/USD Trading Plan for November 9

In this case, there is a recovery in the euro's exchange rate of about half relative to the recent decline, but radical changes are still not observed. The control levels are 1.0650 and 1.0750. Maintaining the price beyond one of these levels could indicate a subsequent price move with possible speculative jumps.

This image is no longer relevant

GBP/USD Trading Plan for November 9

For a subsequent downward turn in the pound's exchange rate, stabilization of the price below the 1.2270 level is required. In this case, movement towards 1.2200 is possible.

Traders will consider an the upward scenario if the area around the 1.2270 level serves as support and the quote rises above the 1.2300 mark.

This image is no longer relevant

What's on the charts

The candlestick chart type is white and black graphic rectangles with lines above and below. With a detailed analysis of each individual candle, you can see its characteristics relative to a particular time frame: opening price, closing price, intraday high and low.

Horizontal levels are price coordinates, relative to which a price may stop or reverse its trajectory. In the market, these levels are called support and resistance.

Circles and rectangles are highlighted examples where the price reversed in history. This color highlighting indicates horizontal lines that may put pressure on the asset's price in the future.

The up/down arrows are landmarks of the possible price direction in the future.

Gven Podolsky,
الخبير التحليلي لدى شركة إنستافوركس
© 2007-2024
كسب عائد من تغيرات أسعار العملات المشفرة مع إنستافوركس.
قم بتحميل منصة التداول ميتاتريدر 4 وافتح أول صفقة.
  • Grand Choice
    Contest by
    InstaForex
    InstaForex always strives to help you
    fulfill your biggest dreams.
    انضم إلى المسابقة
  • إيداع الحظ
    قم بإيداع 3,000 دولار في حسابك واحصل على $10,000 وأكثر من ذالك!
    في ديسمبر نحن نقدم باليانصيب $10,000 ضمن حملة إيداع الحظ!
    احصل على فرصة للفوز من خلال إيداع 3,000 دولار في حساب تداول. بعد أن استوفيت هذا الشرط، تصبح مشاركًا في الحملة.
    انضم إلى المسابقة
  • تداول بحكمة، اربح جهازا
    قم بتعبئة حسابك بمبلغ لا يقل عن 500 دولار ، واشترك في المسابقة ، واحصل على فرصة للفوز بأجهزة الجوال.
    انضم إلى المسابقة
  • بونص 100٪
    فرصتك الفريدة للحصول على بونص 100٪ على إيداعك
    احصل على بونص
  • بونص 55٪
    تقدم بطلب للحصول على بونص 55٪ على كل إيداع
    احصل على بونص
  • بونص 30٪
    احصل على بونص 30٪ في كل مرة تقوم فيها بتعبئة حسابك
    احصل على بونص

المقالات الموصى بها

لا تستطيع التحدث الآن؟
اطرح سؤالك في الدردشة.
Widget callback