empty
 
 
30.10.2023 11:05 AM
EUR/USD, GBP/USD: trading plan for beginners on October 30, 2023

Economic calendar on October 27, 2023:

Last Friday, the macroeconomic calendar was nearly empty. The only report worthy to note was US personal income and spending data.

Statistics details:

Personal Income (m/m) (Sep). Previous: 0.4%, Forecast: 0.4%, Actual: 0.3%

Personal Spending (m/m) (Sep). Previous: 0.4%, Forecast: 0.4%, Actual: 0.7%

Overview of trading charts for October 27, 2023

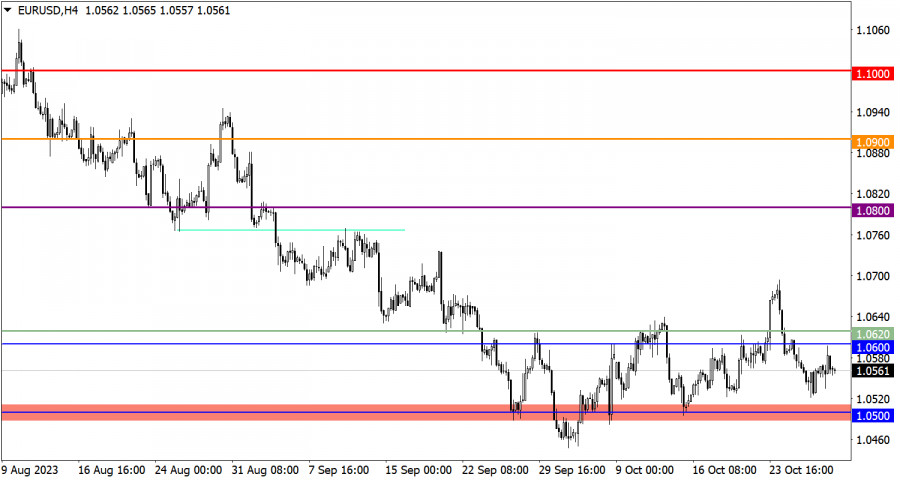
While moving upwards, the euro/dollar pair nearly reached the resistance level of 1.0600. Then the volume of long positions decreased, which allowed the greenback to pare some ground.

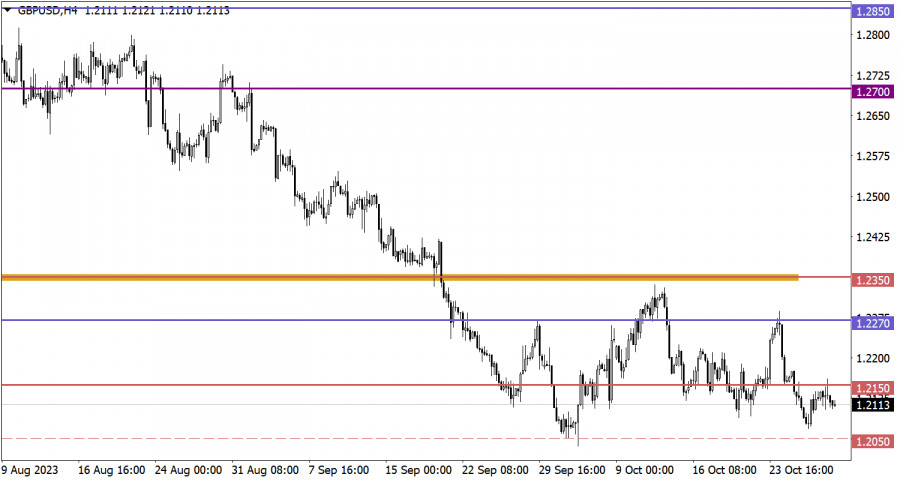
The pound/dollar pair traded in a local uptrend, but no dramatic changes occurred. The quote briefly surged to 1.2150 before reversing and losing value.

This image is no longer relevant

Economic calendar for October 30, 2023

Today's macroeconomic calendar is also bereft of any important news releases, except for UK lending market data.

EUR/USD trading plan for October 30, 2023

The euro/dollar pair is currently pulling back from the resistance level. In the case of a further increase in the volume of short positions, the euro might slide to the support level of 1.0500. However, if the dollar's current bullish run is short-lived and the quote consolidates above 1.0620, the market may move back to the upside.

This image is no longer relevant

GBP/USD trading plan for October 30, 2023

If the quote fails to consolidate above 1.2150, the pound sterling will lose value. A bear case scenario suggests a decline to the 1.2000/1.2150 area. However, if the quote stays firm above 1.2150, the British pound will most likely rise to the levels of 1.2200/1.2250.

This image is no longer relevant

What is shown on trading charts?

Candlestick charts are white and black graphic rectangles with lines above and below. While conducting a detailed analysis of each candlestick, you can notice its features intrinsic to a particular timeframe: the opening price, the closing price, as well as the highest and lowest prices;

Horizontal levels are price coordinates at which the price might pause or reverse. In the market, these levels are called support and resistance.

Circles and rectangles highlight examples where the price earlier reversed. This color highlighting points to horizontal lines that may influence the quote in the future.

Up/down arrows are indicators of possible future price directions.

Traders are recommended to read the following article:

EUR/USD and GBP/USD: Trading plan for beginner traders on October 27, 2023

Gven Podolsky,
الخبير التحليلي لدى شركة إنستافوركس
© 2007-2024
كسب عائد من تغيرات أسعار العملات المشفرة مع إنستافوركس.
قم بتحميل منصة التداول ميتاتريدر 4 وافتح أول صفقة.
  • Grand Choice
    Contest by
    InstaForex
    InstaForex always strives to help you
    fulfill your biggest dreams.
    انضم إلى المسابقة
  • إيداع الحظ
    قم بإيداع 3,000 دولار في حسابك واحصل على $3,000 وأكثر من ذالك!
    في نوفمبر نحن نقدم باليانصيب $3,000 ضمن حملة إيداع الحظ!
    احصل على فرصة للفوز من خلال إيداع 3,000 دولار في حساب تداول. بعد أن استوفيت هذا الشرط، تصبح مشاركًا في الحملة.
    انضم إلى المسابقة
  • تداول بحكمة، اربح جهازا
    قم بتعبئة حسابك بمبلغ لا يقل عن 500 دولار ، واشترك في المسابقة ، واحصل على فرصة للفوز بأجهزة الجوال.
    انضم إلى المسابقة
  • بونص 100٪
    فرصتك الفريدة للحصول على بونص 100٪ على إيداعك
    احصل على بونص
  • بونص 55٪
    تقدم بطلب للحصول على بونص 55٪ على كل إيداع
    احصل على بونص
  • بونص 30٪
    احصل على بونص 30٪ في كل مرة تقوم فيها بتعبئة حسابك
    احصل على بونص

المقالات الموصى بها

لا تستطيع التحدث الآن؟
اطرح سؤالك في الدردشة.
Widget callback