empty
 
 
11.10.2023 10:36 AM
EUR/USD and GBP/USD: Trading plan for beginner traders on October 11, 2023

Details of the Economic Calendar on October 10

The macroeconomic calendar on Tuesday remained practically empty, and the information agenda remained unchanged. Thus, the strengthening of the euro and the British pound appeared to be more of a technical nature.

Analysis of Trading Charts from October 10

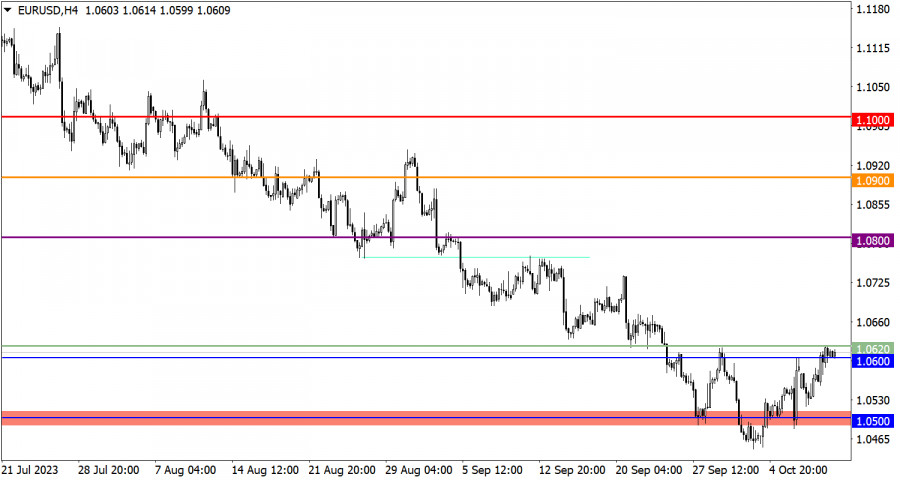
The EUR/USD currency pair reached the upper boundary of the resistance area in the range of 1.0600-1.0620 during the correction phase. This led to a reduced volume of long positions and a slowdown in movement.

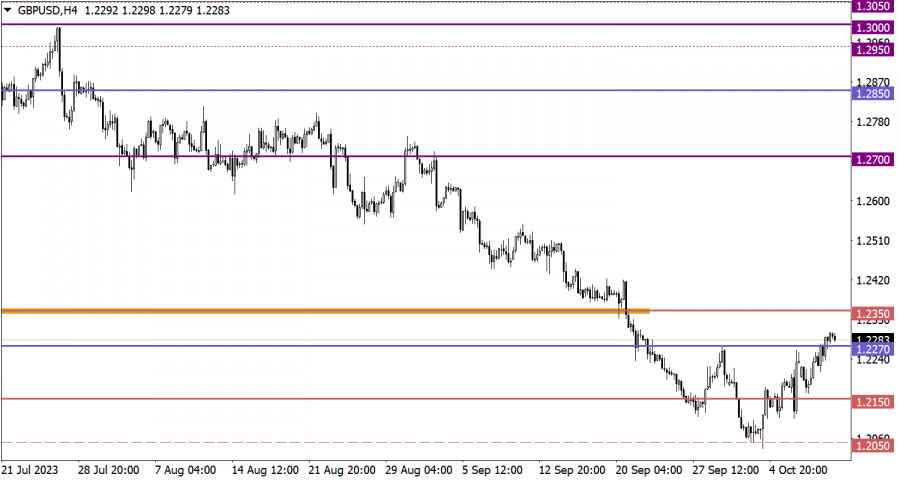
On the other hand, the GBP/USD pair successfully surpassed the 1.2270 resistance level during the corrective movement.

This image is no longer relevant

Economic Calendar on October 11

Today, data on the Producer Price Index in the United States is expected to be published, which growth rates may accelerate from 1.6% to 1.7%. Acceleration in prices indicates limited potential for further inflation slowdown. Therefore, the probability of an additional interest rate hike at least once by the end of this year remains high.

EUR/USD Trading Plan for October 11

To continue the subsequent upward movement, it is necessary for the price to hold above the resistance level. In this case, further growth to the level of 1.0680 is possible. However, if the price does not sustain above this level, a corrective movement towards 1.0550 is possible.

This image is no longer relevant

GBP/USD Trading Plan for October 11

If the price maintains its upward trajectory, an increase in the volume of long positions is possible, with potential further movement towards 1.2350.

Regarding the downside scenario, for its consideration, the price first needs to return below the level of 1.2250.

This image is no longer relevant

What's on the charts

The candlestick chart type is white and black graphic rectangles with lines above and below. With a detailed analysis of each individual candle, you can see its characteristics relative to a particular time frame: opening price, closing price, intraday high and low.

Horizontal levels are price coordinates, relative to which a price may stop or reverse its trajectory. In the market, these levels are called support and resistance.

Circles and rectangles are highlighted examples where the price reversed in history. This color highlighting indicates horizontal lines that may put pressure on the asset's price in the future.

The up/down arrows are landmarks of the possible price direction in the future.

Gven Podolsky,
الخبير التحليلي لدى شركة إنستافوركس
© 2007-2024
كسب عائد من تغيرات أسعار العملات المشفرة مع إنستافوركس.
قم بتحميل منصة التداول ميتاتريدر 4 وافتح أول صفقة.
  • Grand Choice
    Contest by
    InstaForex
    InstaForex always strives to help you
    fulfill your biggest dreams.
    انضم إلى المسابقة
  • إيداع الحظ
    قم بإيداع 3,000 دولار في حسابك واحصل على $3,000 وأكثر من ذالك!
    في نوفمبر نحن نقدم باليانصيب $3,000 ضمن حملة إيداع الحظ!
    احصل على فرصة للفوز من خلال إيداع 3,000 دولار في حساب تداول. بعد أن استوفيت هذا الشرط، تصبح مشاركًا في الحملة.
    انضم إلى المسابقة
  • تداول بحكمة، اربح جهازا
    قم بتعبئة حسابك بمبلغ لا يقل عن 500 دولار ، واشترك في المسابقة ، واحصل على فرصة للفوز بأجهزة الجوال.
    انضم إلى المسابقة
  • بونص 100٪
    فرصتك الفريدة للحصول على بونص 100٪ على إيداعك
    احصل على بونص
  • بونص 55٪
    تقدم بطلب للحصول على بونص 55٪ على كل إيداع
    احصل على بونص
  • بونص 30٪
    احصل على بونص 30٪ في كل مرة تقوم فيها بتعبئة حسابك
    احصل على بونص

المقالات الموصى بها

لا تستطيع التحدث الآن؟
اطرح سؤالك في الدردشة.
Widget callback