Analysis of GBP/USD 5M
The pound traded with sharp negativity on Thursday, which may have caused confusion among many inexperienced traders. Firstly, what does the pound have to do with the European Central Bank? The British currency has its own central bank, and its meeting will take place next week. Secondly, why did the pound fall if the ECB decided to raise its key rate and is likely to continue doing so in 2023? However, as we have mentioned many times before, the market tries to work out in advance all the information that it can more or less accurately predict. The ECB's rate hike was known a month and a half ago, so there was plenty of time to work through this decision. That's why we saw a reverse reaction, which was further amplified when the US published two strong reports on GDP and durable goods orders.
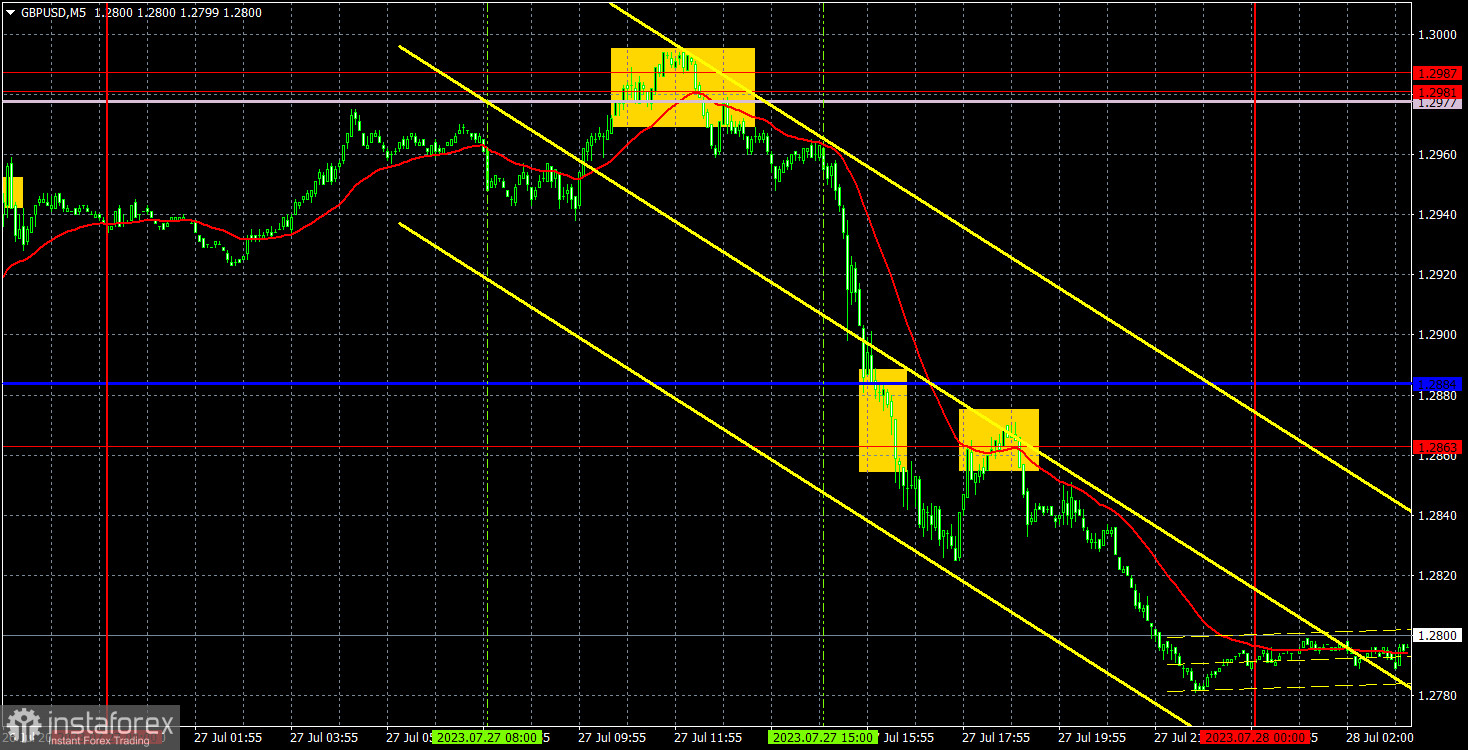
Speaking of trading signals, the first one turned out to be the only one and traders could earn about 150 pips. The price bounced off the area of 1.2977-1.2987, and by the time the ECB announced its results, it had already dropped by 20 pips. Traders could then place a Stop Loss for their short positions at breakeven and calmly observe what was happening in the market. Subsequently, the price did not form any buy signals, so there was no reason to leave the trade before the end of the downward movement.
COT report:
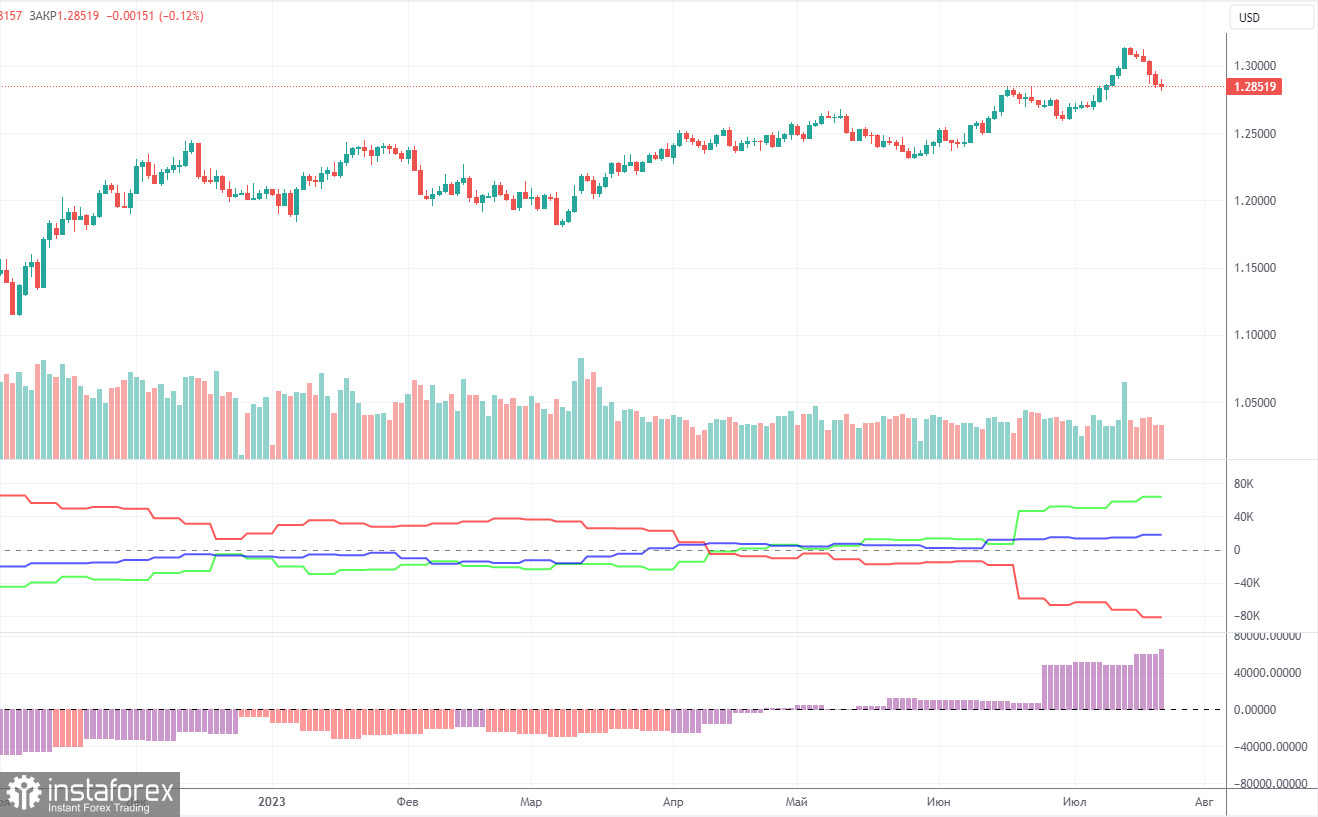
According to the latest report, the non-commercial group of traders opened 23,600 long positions and 17,900 short ones. Thus, the net position of non-commercial traders rose by 5,700 positions in a week. It continued to rise. The net position has been steadily growing over the past 10 months as well as the pound sterling. Now, the net position has advanced markedly. This is why the pair will hardly maintain its bullish momentum. I believe that a long and protracted downward movement should begin. COT reports signal a slight growth of the British currency but it will not be able to rise in the long term. There are no drivers for opening new long positions. However, there are no technical signals for short positions yet.
The British currency has already grown by a total of 2,800 pips. Without a downward correction, the continuation of the uptrend will be illogical. The Non-commercial group of traders has opened 135,200 long positions and 71,500 short ones. I remain skeptical about the long-term growth of the pound sterling but speculators continue to buy because the pair is growing.
Analysis of GBP/USD 1H
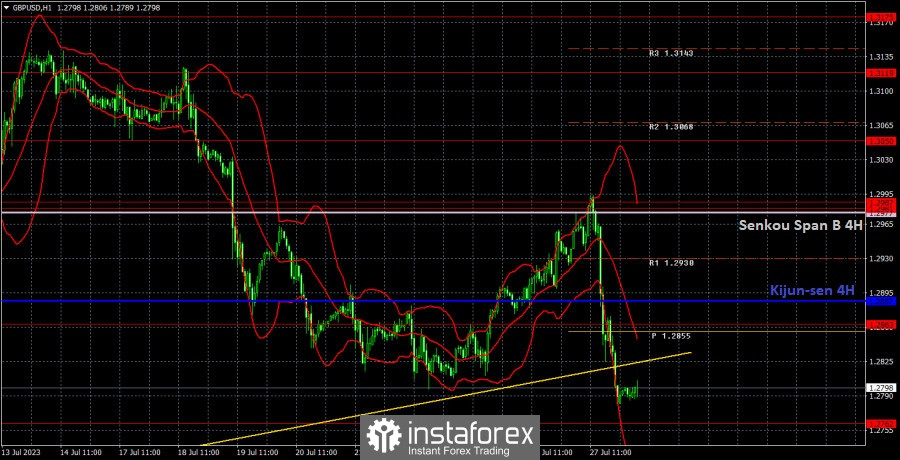
On the 1H chart, the pound/dollar pair ended its upward movement near the Senkou Span B line. So, traders can take a breather and enjoy logical movements for some time. The ascending trendline has been breached, but the Senkou Span B line stands firm, and that's how the situation was turned upside down in practically just a day. Yesterday, we entertained the possibility of a resumption of the uptrend, which had no real basis, but today everything points to the pound's fall.
On July 28, traders should pay attention to the following key levels: 1.2598-1.2605, 1.2693, 1.2762, 1.2863, 1.2981-1.2987, 1.3050, 1.3119, 1.3175, 1.3222, 1.3273. The Senkou Span B line (1.2977) and the Kijun-sen line (1.2887). The Senkou Span B line (1.2977) and Kijun-sen line (1.2884) can also be sources of signals, e.g. rebounds and breakout of these levels and lines. It is recommended to set the Stop Loss orders at the breakeven level when the price moves in the right direction by 20 pips. The lines of the Ichimoku indicator can move during the day, which should be taken into account when determining trading signals. There are support and resistance levels that can be used to lock in profits.
On Friday, there are no important reports lined up in the UK. On the other hand, the US will release data on personal income and spending, the Personal Consumption Expenditures Price Index, and the University of Michigan Consumer Sentiment Index. Although these reports are not highly important, they can still influence the pair's movement if the latest numbers significantly differ from forecasts.
Description of the chart:
Support and resistance levels are thick red lines near which the trend may end. They do not provide trading signals;
The Kijun-sen and Senkou Span B lines are the lines of the Ichimoku indicator, plotted to the 1H timeframe from the 4H one. They provide trading signals;
Extreme levels are thin red lines from which the price bounced earlier. They provide trading signals;
Yellow lines are trend lines, trend channels, and any other technical patterns;
Indicator 1 on the COT charts is the net position size for each category of traders;
Indicator 2 on the COT charts is the net position size for the Non-commercial group.