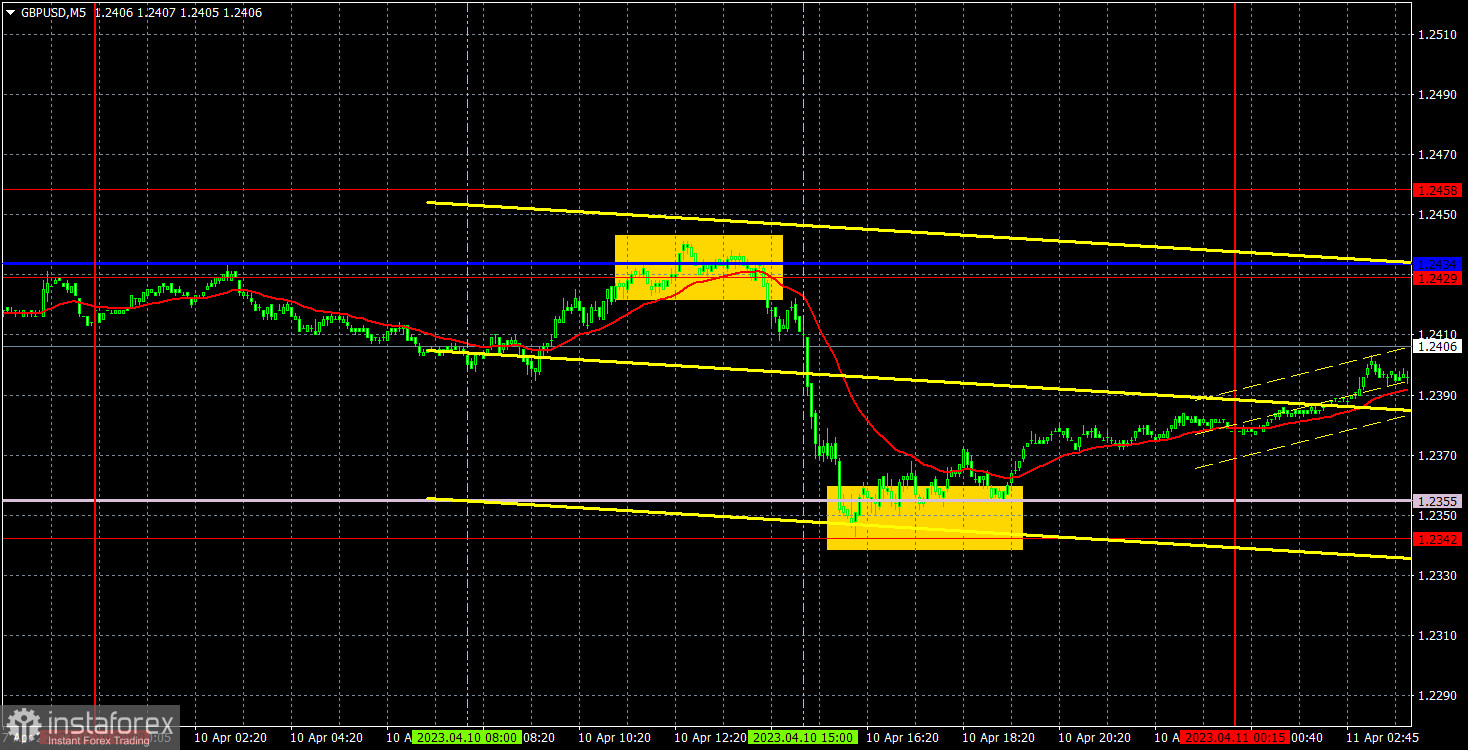
Analysis of GBP/USD 5M.
On Monday, the currency pair GBP/USD declined to the ascending trend line but failed to break through. Any trend line now plays a purely formal role. Over the past few months, we have seen enough trend lines overcome, but the trend itself does not change - the pound predominantly grows. Thus, even if the price goes below the trend line in the coming days, it will not mean that the long-awaited fall of the pound sterling will begin. A decline in the British currency would be the most logical and justified development of events, but if the market does not think so, there will be no decline. Yesterday's pair decline was related to the good American statistics on Friday. Since Friday was a half-holiday (Monday, too), traders divided the reaction into two days. The pair also failed to break through the Senkou Span B line, so there is no need to count on strong dollar growth yet.
There were few trading signals on Monday. The Kijun-sen line had to be rebuilt during the day, and this action allowed for a good sell signal around the level of 1.2429. It should have been worked out with a short position, and the price subsequently dropped to the Senkou Span B and the level of 1.2342, where shorts should have been closed. The profit on them was about 50 points, which is pretty good. The buy signal was also quite good but was formed too late, so it should not have been worked out.
COT Report:
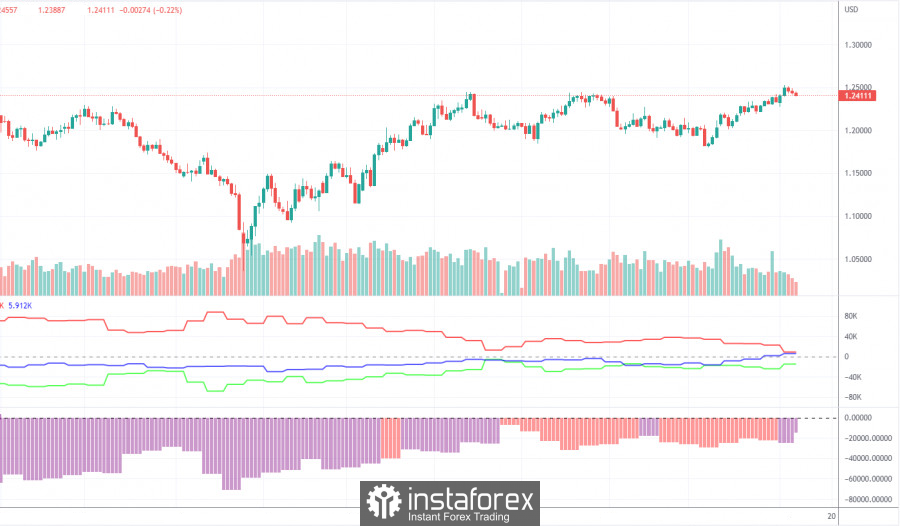
According to the COT reports for the British pound, they have started to catch up with the times. The latest available report is for April 4th. According to this report, the "Non-commercial" group opened 18,000 buy contracts and 8,800 sell contracts. Thus, the net position of non-commercial traders increased by 9,200 and continues to grow. The net position indicator has been steadily growing for the past 7-8 months, but the sentiment of major players remains "bearish." Although the pound sterling is growing against the dollar (in the medium-term perspective), it is challenging to answer why it does so from a fundamental point of view. We do not rule out the option that a more substantial decline in the pound will begin soon. Formally, it has already begun, but this movement looks more like a flat so far. We also note that both major pairs are now moving roughly the same. Still, the net position for the euro is positive and already implies the completion of the upward impulse, while for the pound, it is negative, allowing for further growth. The British currency is already 2,100 points up, which is a lot, and continuing to grow without a strong downward correction would be utterly illogical. The "Non-commercial" group now has 61,000 sell contracts and 46,000 buy contracts open. We remain skeptical about the long-term growth of the British currency and expect its decline.
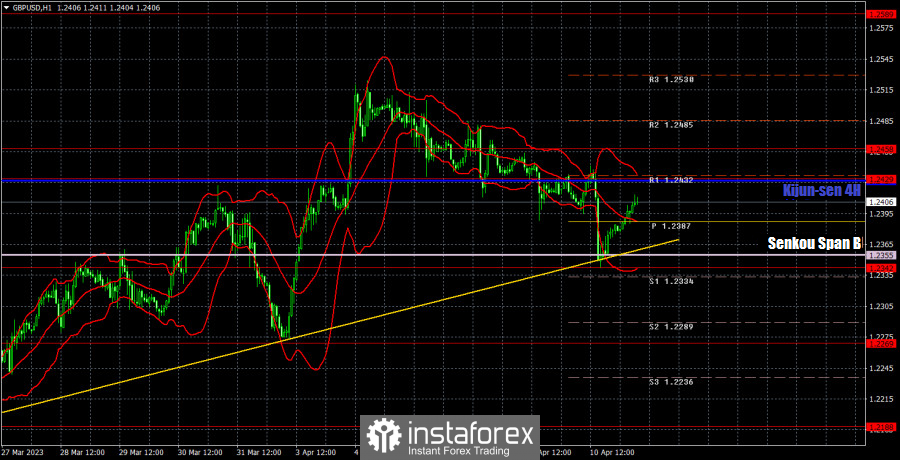
Analysis of GBP/USD 1H.

On the hourly timeframe, the pound/dollar pair maintains an upward trend, although it has been corrected in recent days. There are still no reasons for the British pound to grow, but market participants ignore this fact. Therefore, the pair may resume its movement to the North, even if there are no reasons for this. The price is still located above the trend line and the Senkou Span B line, so from a technical point of view, there are more chances for the pair to grow. For April 11th, we highlight the following important levels: 1.1927, 1.1965, 1.2143, 1.2185, 1.2269, 1.2342, 1.2429-1.2458, 1.2589, 1.2659, 1.2762. Senkou Span B (1.2355) and Kijun-sen (1.2427) lines can also be sources of signals. Signals can be "bounces" and "overcomings" of these levels and lines. Setting the Stop Loss level to breakeven when the price moves in the right direction by 20 points is recommended. The Ichimoku indicator lines may move during the day, which should be considered when determining trading signals. The illustration also shows support and resistance levels that can be used to fix profits on trades. On Tuesday, no significant events are planned in the UK and the US, so volatility may remain low, and movements may be chaotic and non-trending.
Explanations for the illustrations:
Support and resistance price levels - thick red lines around which movement can end. They are not sources of trading signals.
Kijun-sen and Senkou Span B lines - Ichimoku indicator lines transferred to the hourly timeframe from the 4-hour timeframe. They are strong lines.
Extreme levels - thin red lines from which the price has previously bounced. They are sources of trading signals.
Yellow lines - trend lines, channels, and other technical patterns.
Indicator 1 on the COT charts - the net position size of each category of traders.
Indicator 2 on the COT charts - the net position size for the "Non-commercial" group.