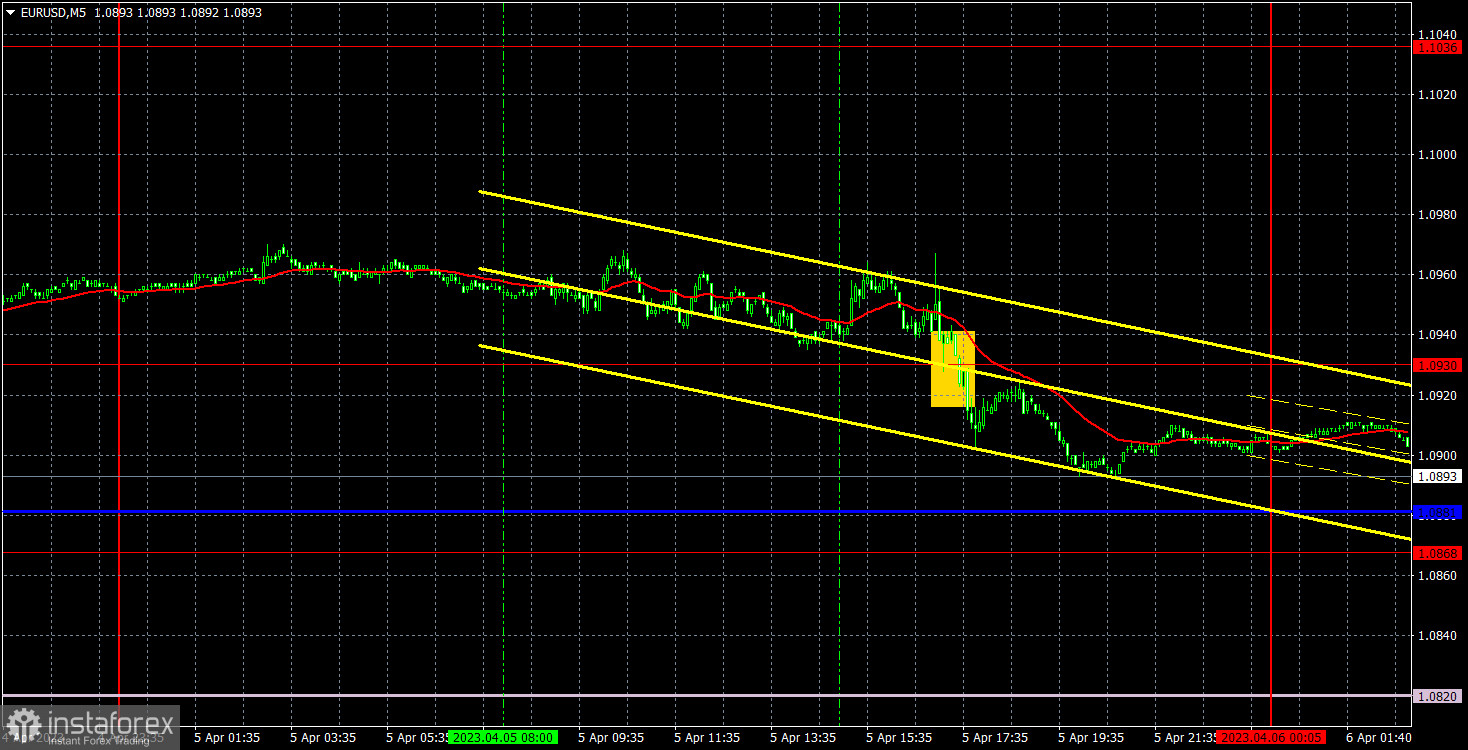
5M chart of EUR/USD
On Wednesday, EUR/USD started trading lower, which does not allow us to draw any long conclusions. I've been saying for a long time that I expect the euro to fall, but a fall of 70 pips is obviously not what we expect. In our fundamental articles, we already mentioned that just yesterday, the dollar had every reason to fall. But ironically, it strengthened. Therefore, there is no logic in the movements. On the one-hour chart, the price is above the Ichimoku indicator lines, so we can't talk about a new downtrend until the pair breaks through them. There is also no point in discussing the trend lines. That is why it is better to go with the strongest Senkou Span B line and trade on the weakest timeframe.
By the way, the volatility is not very high now either. Yesterday, there was only one sell signal near 1.0930. It did not bring much profit to traders. Until the evening, the pair was moving in the right direction for a total of about 10 points. That is how much traders could earn. The price is approaching the Senkou Span B and Kijun Sen lines, so it will become clear what to expect from the pair in the near future.
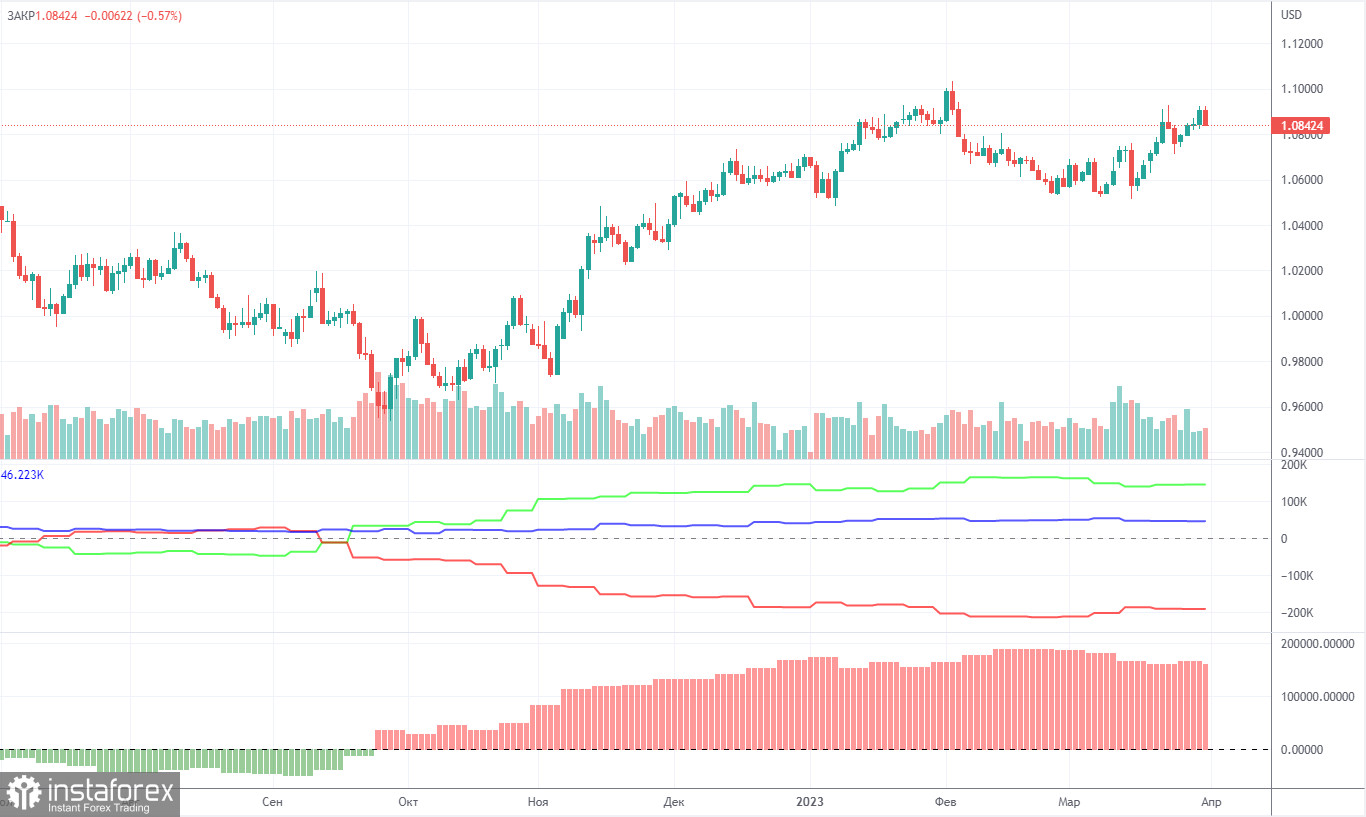
COT report:
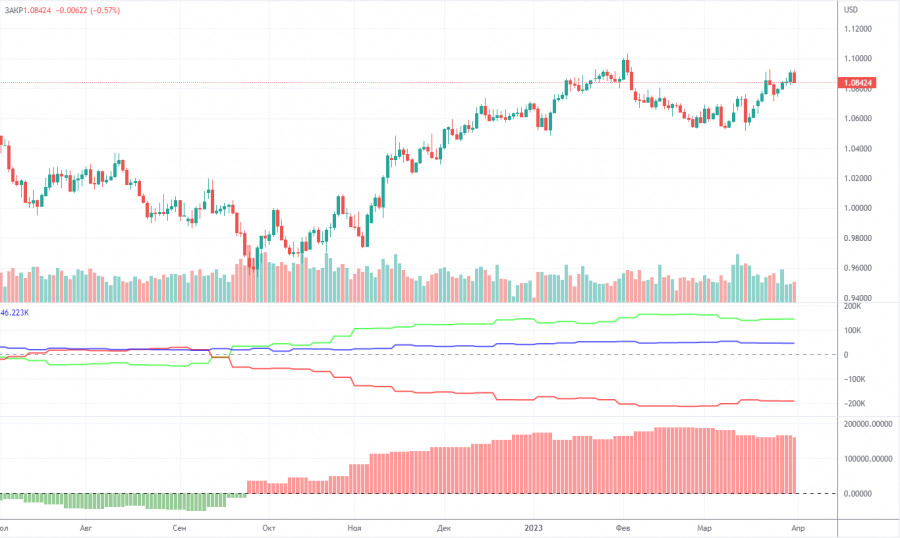
On Friday, a new COT report was issued. In the chart above, we see that the net position of big traders (the second indicator) has been growing since the beginning of September 2022. The European currency started growing also at that time. At present, the net position of non-commercial traders remains bullish and very high as well as the euro, which cannot correct downwards at the moment. We have already mentioned that quite a high reading of the net position points to a possible end of the uptrend. This could be seen on the first indicator where the red and green lines are far from each other. This often precedes the end of a trend. The euro made an attempt to launch a downward correction but it is just a rebound. During the last given period, the number of buy contracts opened by non-commercial traders increased by 7.1K, whereas the number of short orders jumped by 6.9K. As a result, the net position remained almost the same. The number of buy contracts exceeds the number of sell contracts by 145K. Thus, the pair is expected to resume falling.
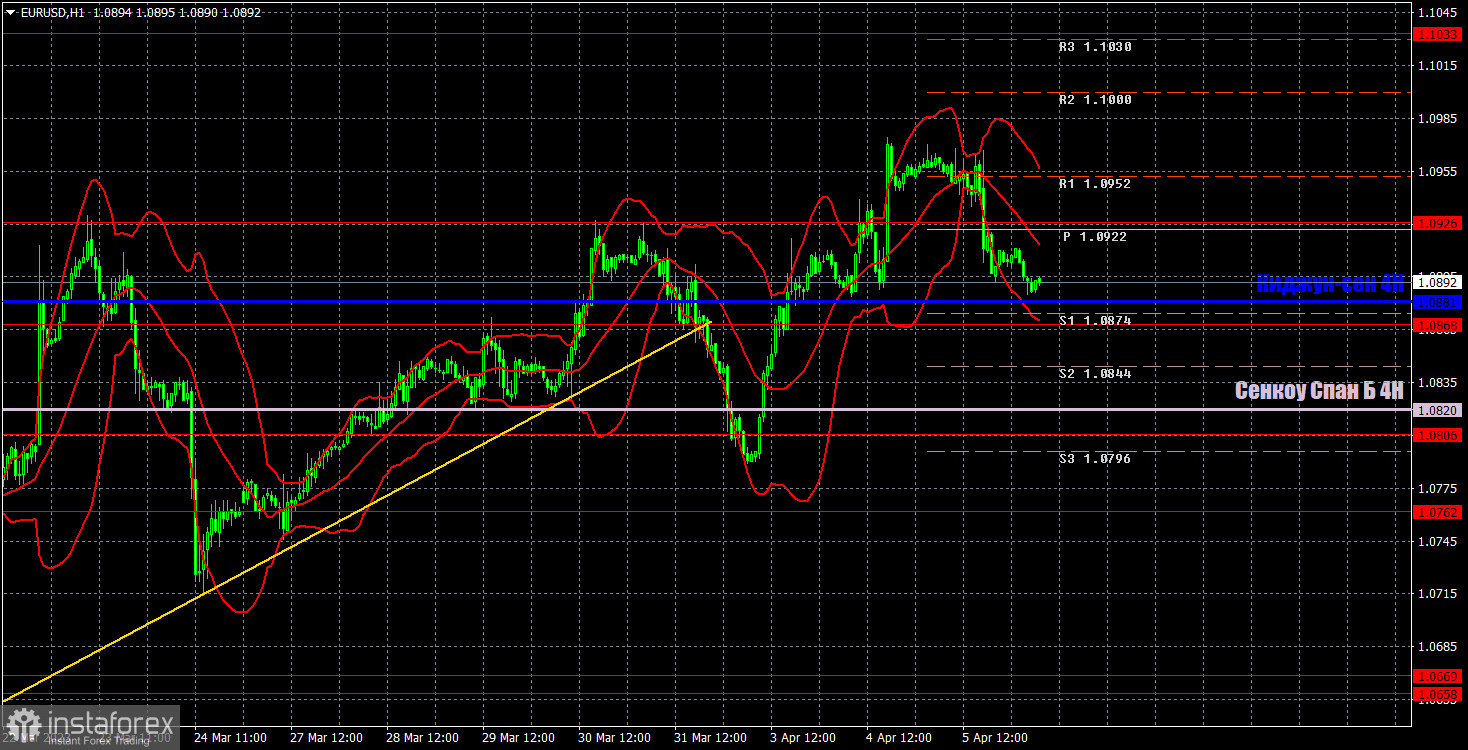
1H chart of EUR/US
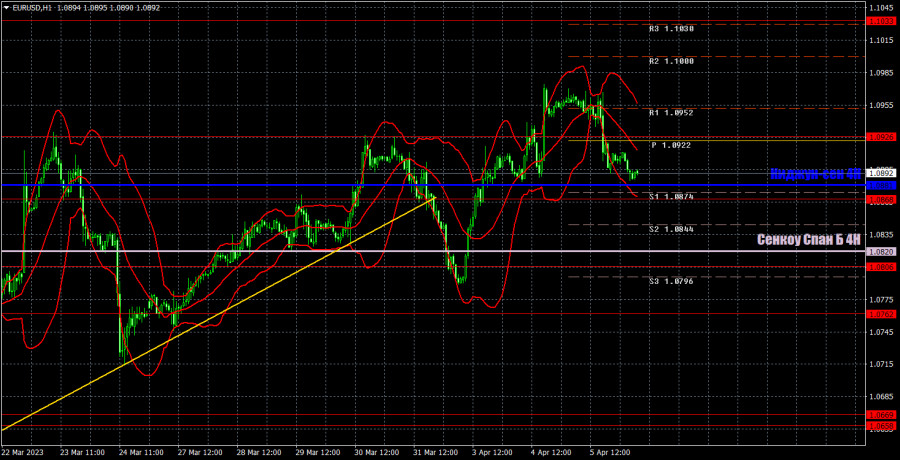
On the one-hour chart, EUR/USD maintains an uptrend even without a trend line. The euro can start rising at any time, even without sufficient reason. We can only consider the start of a downtrend once the price settles below the Ichimoku indicator lines on the one-hour chart. On Thursday, important levels are seen at 1.0581, 1.0658-1.0669, 1.0762, 1.0806, 1.0868, 1.0930, 1.1033, 1.1137-1.1185, 1.1234, 1.1274 and also Senkou Span B (1.0820) and Kijun Sen (1.0881) lines. Ichimoku indicator lines can move intraday, which should be taken into account when determining trading signals. There are also support and resistance although no signals are made near these levels. They could be made when the price either breaks or rebounds from these extreme levels. Do not forget to place Stop Loss at the breakeven point when the price goes by 15 pips in the right direction. In case of a false breakout, it could save you from possible losses. There are no important events scheduled for April 6 in the EU and the US. The US jobless claims report will be released and Federal Reserve representative James Bullard, who has no voting rights this year, will speak. The market reaction to all events and reports is either illogical or simply non-existent.
Indicators on charts:
Resistance/support - thick red lines, near which the trend may stop. They do not make trading signals.
Kijun-sen and Senkou Span B are the Ichimoku indicator lines moved to the hourly timeframe from the 4-hour timeframe. They are also strong lines.
Extreme levels are thin red lines, from which the price used to bounce earlier. They can produce trading signals.
Yellow lines are trend lines, trend channels, and any other technical patterns.
Indicator 1 on the COT chart is the size of the net position of each trader category.
Indicator 2 on the COT chart is the size of the net position for the Non-commercial group of traders.