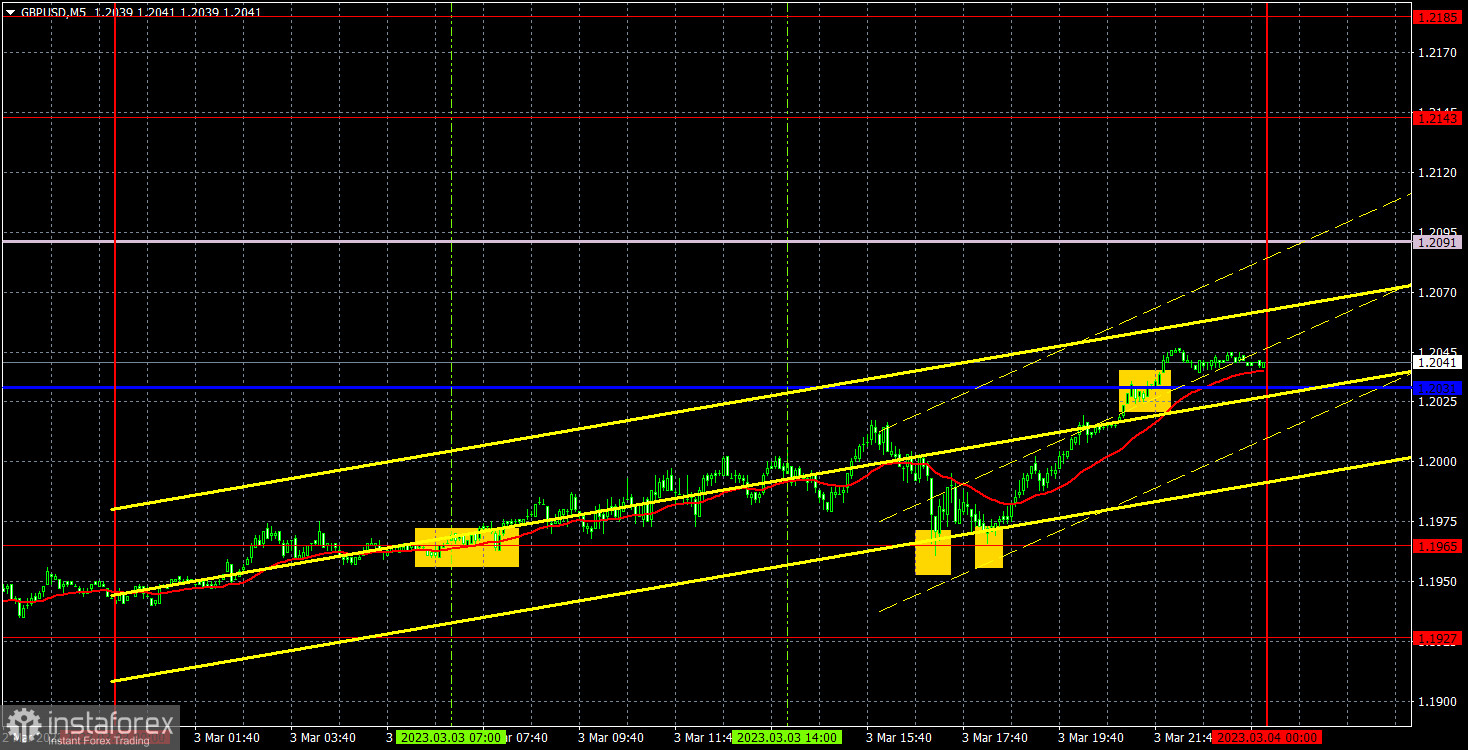
M5 chart of GBP/USD
On Friday, GBP/USD traded in line with expectations. It fell to 1.1927, rebounded, and traded bullish in a sideways channel. The Ichimoku lines have almost merged due to the flat trend, and therefore no longer matter. Hypothetically, signals may be generated near them. However, there may be more false signals than true ones. On Friday, the UK and the US both saw the release of their business activity data in the services sector. The reports came upbeat enough, so the pair was mostly bullish during the day. At the same time, the pair is trading under the influence of technical factors. Therefore, after bouncing off 1.1927, an uptrend would follow anyway.
Three almost identical buy signals came during the day. Each time, the price bounced off 1.1927. The first two signals were priced, with the pair going over 30 pips in the right direction both times. That was enough for placing a Stop Loss at the breakeven point but not enough for yielding a profit. Therefore, the day likely ended without any profit or losses.
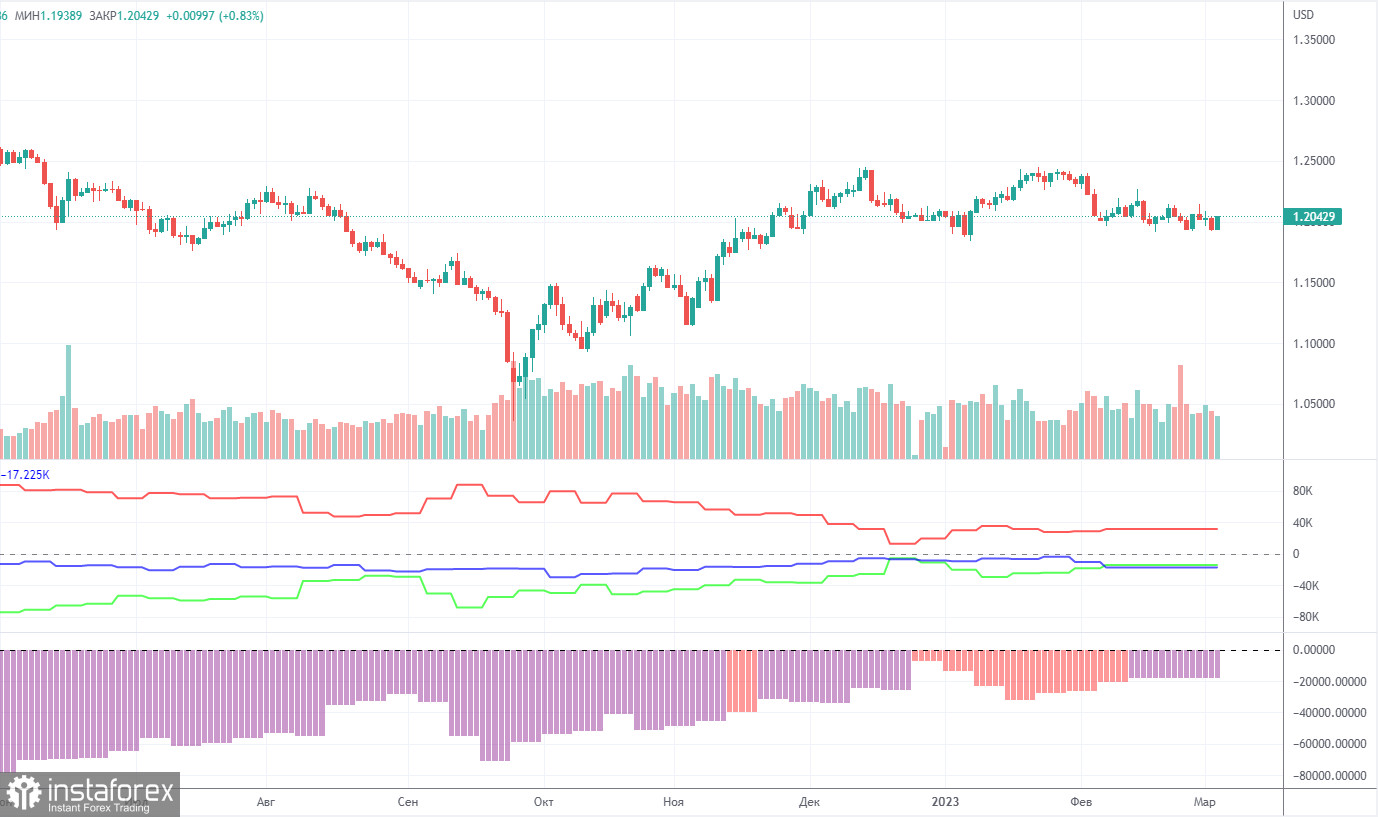
COT report:
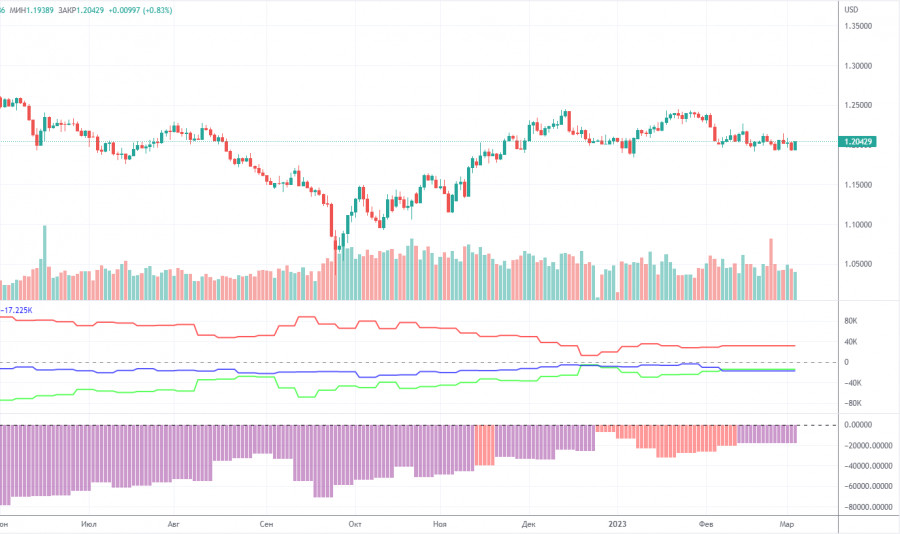
The latest COT report on GBP/USD dates back to February 7. Due to a technical glitch, there have been no fresh reports for about a month. Naturally, analyzing outdated reports is of no use. Anyway, that is better than nothing at all. According to the latest data, non-commercial traders opened 10,900 long positions and 6,700 short ones. The net position grew by 4,200. The net non-commercial position has been bullish in recent months although sentiment remains bearish. The pound has been on the rise against the greenback for some unknown reason. We should not rule out the possibility of a strong decline in price in the near term. Technically, it has already started to decline although it seems to be a flat trend. In fact, the movement of GBP/USD is now akin to that of EUR/USD. At the same time, the net position on EUR/USD is positive, signaling the upcoming end of the bullish impulse. Meanwhile, the net position on GBP/USD is negative. Non-commercial traders now hold 61,000 short positions and 47,000 long positions. There is still a gap. We remain skeptical that the pair will be bullish in the long term and expect a steep drop.
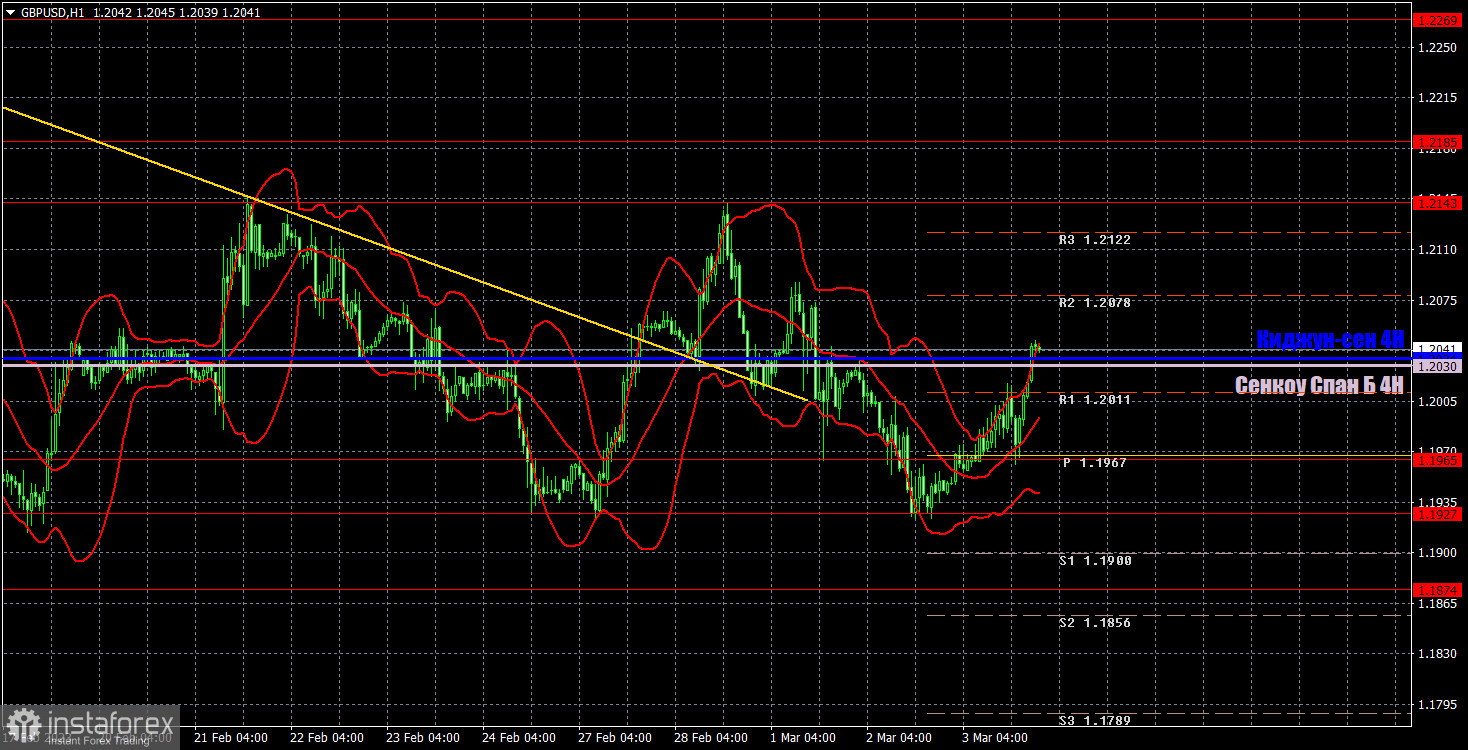
H1 chart of GBP/USD
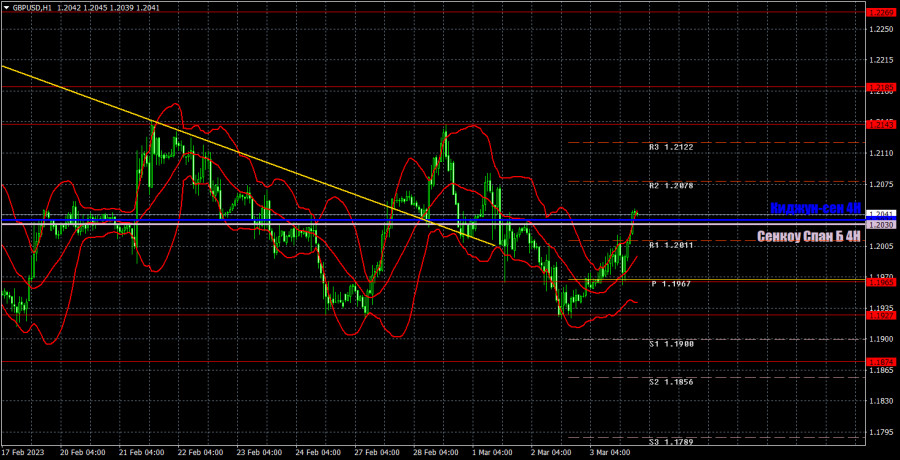
In the H1 time frame, GBP/USD keeps fluctuating with the Ichimoku lines losing strength temporarily. After the close above the descending trend line, nothing has changed. The uptrend didn't begin. The pair failed to update its latest swing high. It remains to be seen whether it breaks through the lower limit of the sideways channel at 1.1927 as we expect a bearish continuation. On March 6, trading levels are seen at 1.1760, 1.1874, 1.1927, 1.1965, 1.2143, 1.2185, and 1.2269. Senkou Span B (1.2030) and Kijun-sen (1.2034) may also generate signals when the price either breaks or bounces off them. A Stop Loss should be placed at the breakeven point when the price goes 20 pips in the right direction. Ichimoku indicator lines can move intraday, which should be taken into account when determining trading signals. There are also support and resistance which can be used for locking in profits. On Monday, no releases are scheduled in the UK and the US. Traders will have nothing to react to, and the pair will keep hovering.
Indicators on charts:
Resistance/support - thick red lines, near which the trend may stop. They do not make trading signals.
The Kijun-sen and Senkou Span B lines are the Ichimoku indicator lines moved to the hourly timeframe from the 4-hour timeframe. They are also strong lines.
Extreme levels are thin red lines, from which the price used to bounce earlier. They can produce trading signals.
Yellow lines are trend lines, trend channels, and any other technical patterns.
Indicator 1 on the COT chart is the size of the net position of each trader category.
Indicator 2 on the COT chart is the size of the net position for the Non-commercial group of traders.