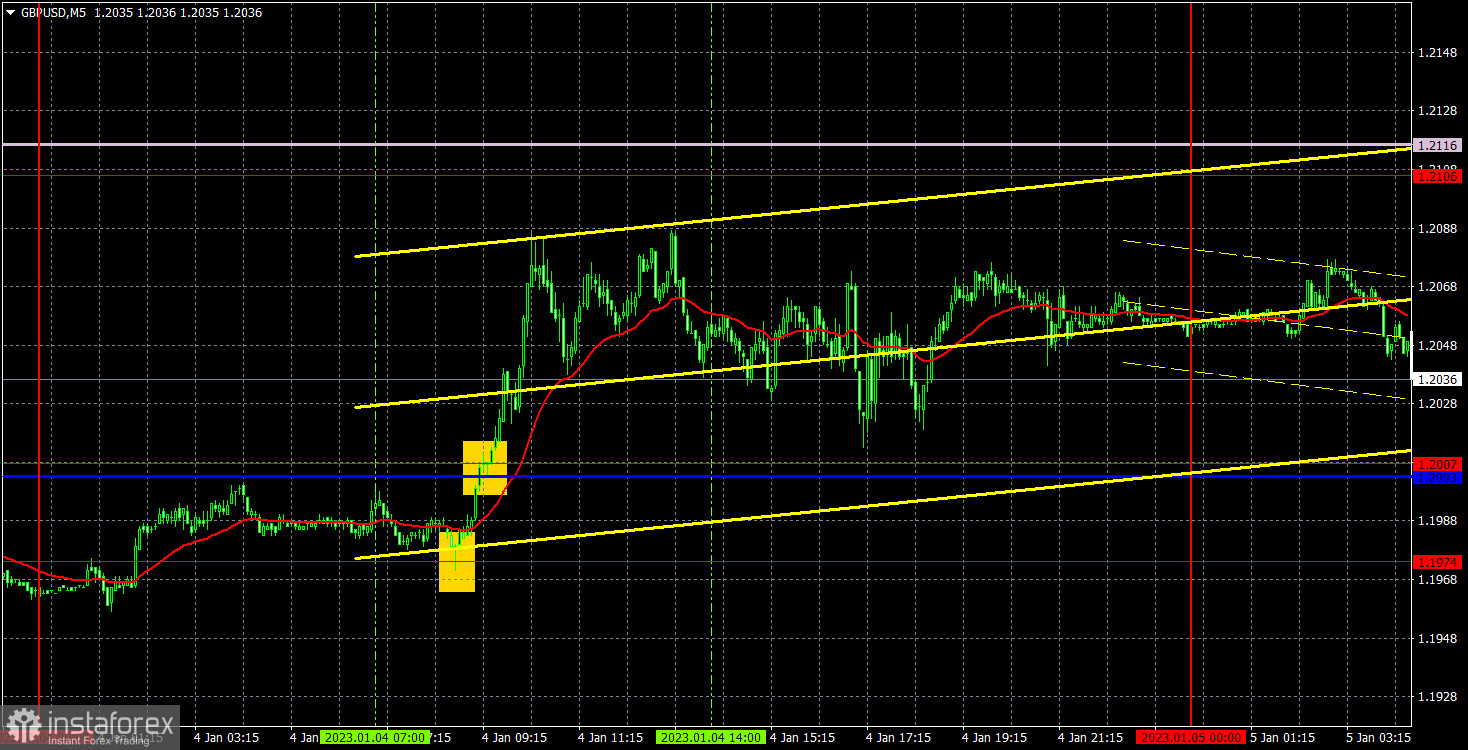
M5 chart of GBP/USD
On Wednesday, GBP/USD returned both to the horizontal channel and to the area between the Kijun-Sen and Senkou Span B lines. Thus, the pair is exactly where it has been for the last few weeks - in an absolute flat between 1.2007-1.2106. Right now I don't think that the flat has resumed, but we cannot fully exclude such an option. We should keep in mind that there were no reasons for the pound to fall by 150 points on Tuesday. So yesterday, the market could simply return to its initial positions. In fact, the only macroeconomic event was the US ISM Manufacturing PMI. It fell to 48.4 points in December, which was worse than the most pessimistic forecasts. So overall, we can consider the dollar's fall as logical. The fall happened at night and in the morning, and during the day the pair was in the same place. That's why I think that there was almost no reaction to the ISM report.
Speaking of Wednesday's trading signals, it was as simple as possible. There was a buy signal in the 1.1974-1.2007 area in the morning, inside which also lay the Kijun-sen line. A consolidation above this area made it possible for traders to open long positions, but for the rest of the day, the price failed to reach the nearest target level of 1.2106. Therefore, a long position should have been closed manually anyway. The profit on it was 30-40 pips, which is not too bad.
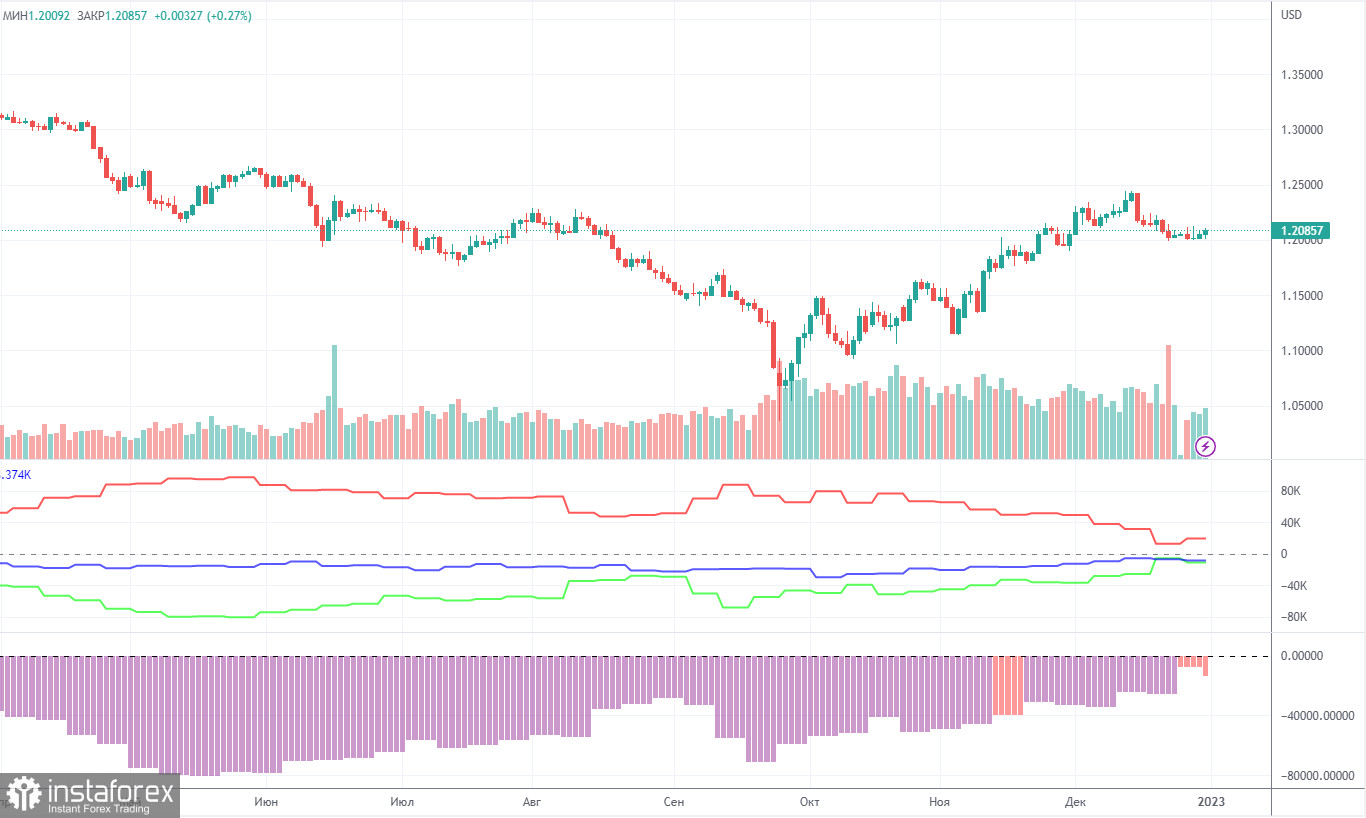
COT report
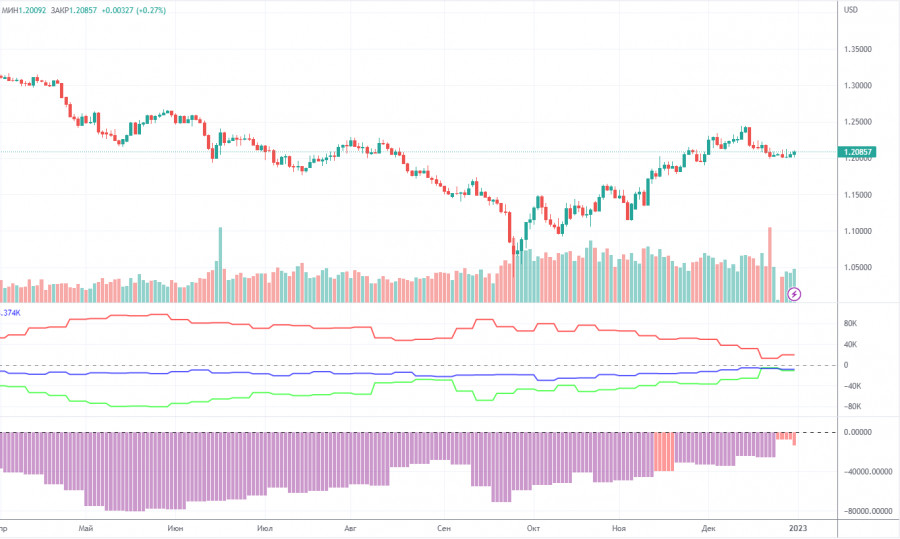
The latest COT report showed that bearish sentiment had weakened. During the given period, non-commercial traders opened 5,300 long positions and as many as 10,600 short positions. Thus, the net position fell by about 5,300. This figure has been on the rise for several months, and the sentiment may become bullish in the near future. Although the pound has grown against the dollar for the last few weeks, it is still difficult to answer why it keeps rising. On the other hand, it could fall in the near future (in the mid-term prospect) because it still needs a correction. In general, in recent months the COT reports correspond to the pound's movements so there shouldn't be any questions. Since the net position is not even bullish yet, buying may continue for a few months to come. Non-commercial traders now hold 40,600,000 long positions and 51,500 short ones. I am still skeptical about the pound's long term growth, though there are technical reasons for it. At the same time, fundamental and geopolitical factors signal that the currency is unlikely to strengthen significantly.
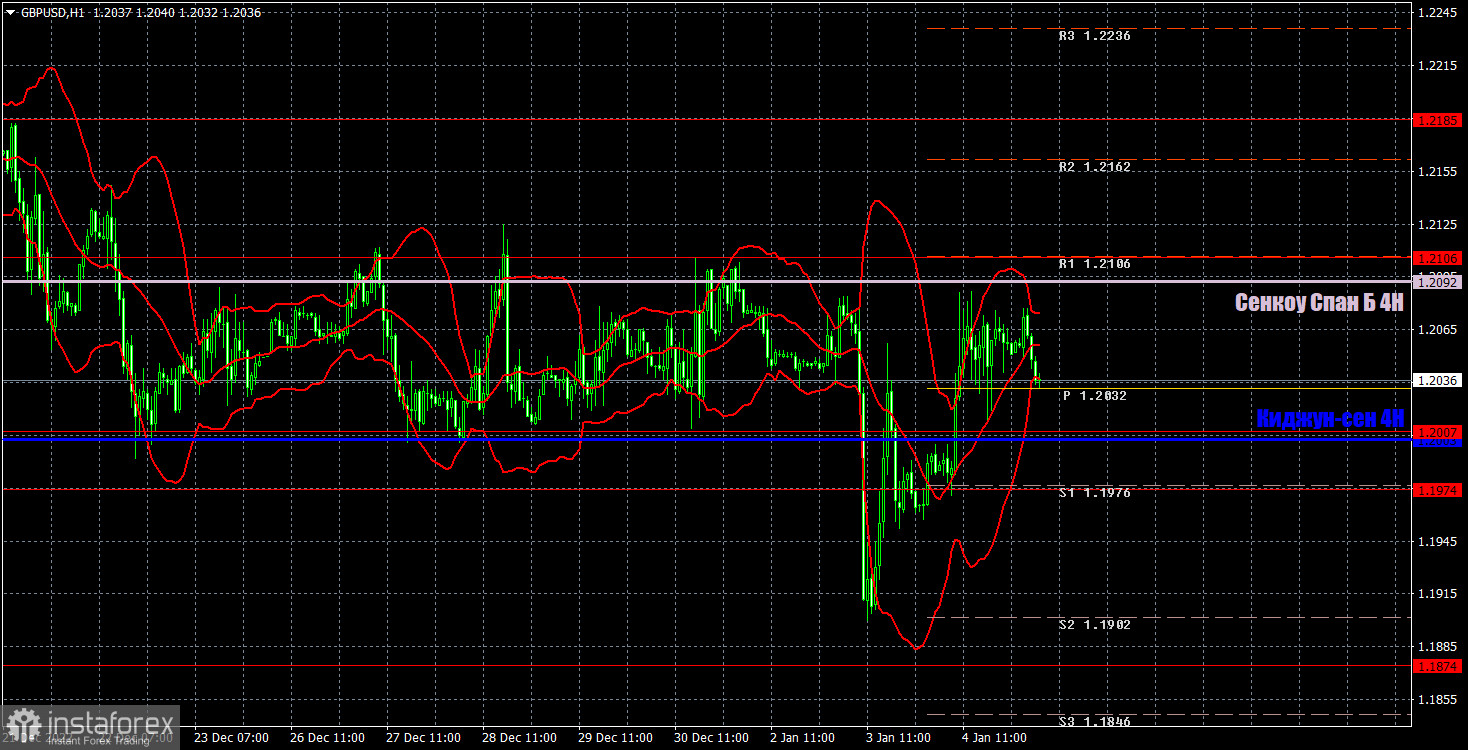
H1 chart of GBP/USD
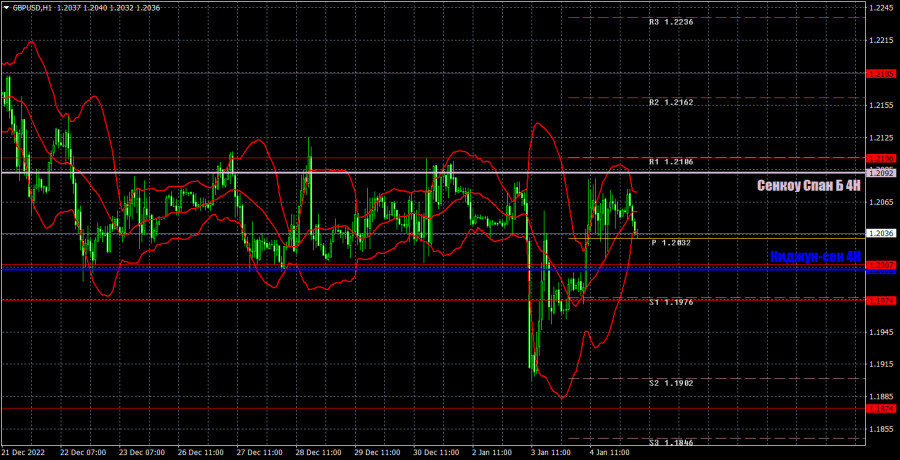
On the one-hour chart, GBP/USD sharply left the horizontal channel and also sharply returned to it. Thus, traders now have the right to expect the flat. Granted that I expect the pound to fall, so far there aren't many technical signals for selling. Such signals may be considered as a rebound from the Senkou Span B line or consolidation below the critical line, which lies just at the lower limit of the horizontal channel. On January 5, the pair may trade at the following levels: 1.1645, 1.1760, 1.1874, 1.1974-1.2007, 1.2106, 1.2185, 1.2259. Senkou Span B (1.2092) and Kijun Sen (1.2003) lines may also generate signals. Pullbacks and breakouts through these lines may produce signals as well. A Stop Loss order should be set at the breakeven point after the price passes 20 pips in the right direction. Ichimoku indicator lines may move during the day, which should be taken into account when determining trading signals. In addition, the chart does illustrate support and resistance levels, which could be used to lock in profits. On Thursday, the UK will publish the index of business activity in the service sector in the second estimate for December, which may rise to 50.0. But I don't think this report is overly important. The only other important data in America are ADP, unemployment claims and S&P service sector index for December at its second estimate.
What we see on the trading charts:
Price levels of support and resistance are thick red lines, near which the movement may end. They do not provide trading signals.
The Kijun-sen and Senkou Span B lines are the lines of the Ichimoku indicator, moved to the one-hour chart from the 4-hour one. They are strong lines.
Extreme levels are thin red lines from which the price bounced earlier. They provide trading signals.
Yellow lines are trend lines, trend channels, and any other technical patterns.
Indicator 1 on the COT charts reflects the net position size of each category of traders.
Indicator 2 on the COT charts reflects the net position size for the non-commercial group.