empty
 
 
06.12.2022 10:06 AM
EUR/USD and GBP/USD: trading plan for beginners on December 6, 2022

Macroeconomic calendar on December 5th

Yesterday, the United Kingdom, the eurozone, and the United States saw the release of business activity data.

In the eurozone, the services PMI dropped to 48.5 from 48.6.

In the United Kingdom, the services PMI remained at 48.8 in November.

In the United States, the services PMI fell to 47.8 versus 47.8 in November.

The results had no effect on the market as they came in line with preliminary forecasts.

In the eurozone, retail sales data came in at -2.7%, well below market estimates of -2.2%. Therefore, the previous revision of statistics to 0.0% from 0.6% had little influence on the euro.

Overview of technical charts of December 5th

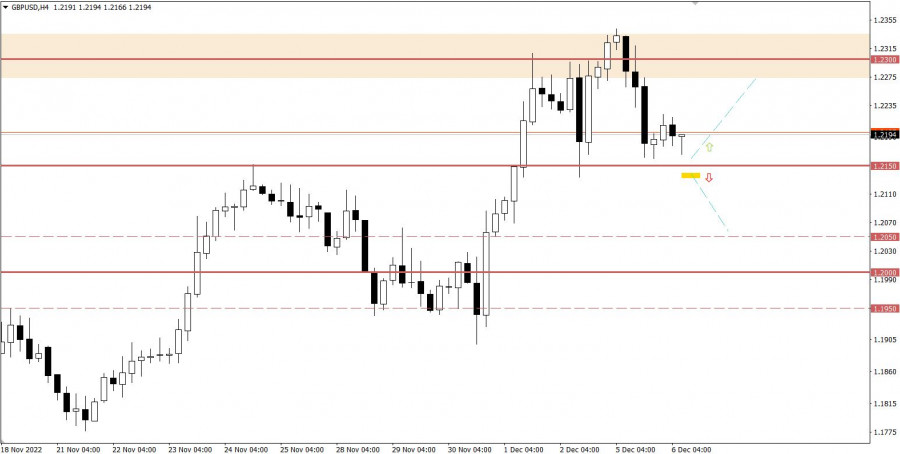
The GBP/USD pair failed to settle above 1.2300. Consequently, a reversal occurred, and the quote fell to 1.2150, in line with support. Notably, the analysis of the basket of major currencies shows that the greenback strengthened against all its counterparts during the North American session yesterday.

The GBP/USD pair resumed growth after a brief pause at 1.2300. As a result, a breakout through resistance took place, and the quote consolidated above the barrier.

This image is no longer relevant

Macroeconomic calendar on December 6th

The macroeconomic calendar is empty today, as no important releases are scheduled in the United Kingdom, the eurozone, and the United States.

In this light, investors and traders will be analyzing the news stream.

Trading plan for EUR/USD on December 6th

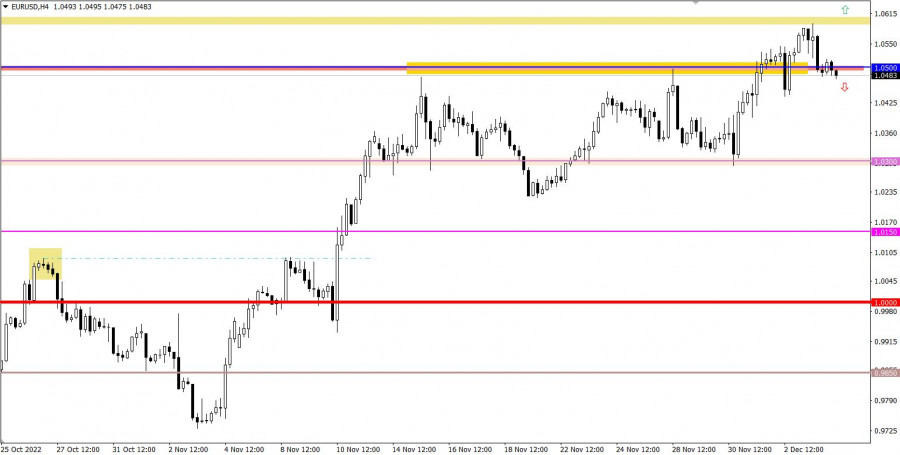
Prolonged consolidation below 1.0500 may trigger a full-fledged correction with the target at 1.0300.

If the pair goes up, the price should return at least above 1.0500. Consolidation above 1.0600 on the H4 chart will generate a buy signal.

This image is no longer relevant

Trading plan for GBP/USD on December 6th

A correction will be confirmed once the price settles below 1.2150 on the H4 chart. In this case, the pair may drop to 1.2000.

Alternatively, the price may increase after a rebound at 1.2150.

This image is no longer relevant

What's on technical charts

The candlestick chart shows graphical white and black rectangles with upward and downward lines. While conducting a detailed analysis of each individual candlestick, it is possible to notice its features intrinsic to a particular time frame: the opening price, the closing price, and the highest and lowest price.

Horizontal levels are price levels, in relation to which a stop or reversal of the price may occur. They are called support and resistance levels.

Circles and rectangles are highlighted examples where the price reversed in the course of its history. This color highlighting indicates horizontal lines which can exert pressure on prices in the future.

Upward/downward arrows signal a possible future price direction.

Gven Podolsky,
الخبير التحليلي لدى شركة إنستافوركس
© 2007-2024
كسب عائد من تغيرات أسعار العملات المشفرة مع إنستافوركس.
قم بتحميل منصة التداول ميتاتريدر 4 وافتح أول صفقة.
  • Grand Choice
    Contest by
    InstaForex
    InstaForex always strives to help you
    fulfill your biggest dreams.
    انضم إلى المسابقة
  • إيداع الحظ
    قم بإيداع 3,000 دولار في حسابك واحصل على $3,000 وأكثر من ذالك!
    في نوفمبر نحن نقدم باليانصيب $3,000 ضمن حملة إيداع الحظ!
    احصل على فرصة للفوز من خلال إيداع 3,000 دولار في حساب تداول. بعد أن استوفيت هذا الشرط، تصبح مشاركًا في الحملة.
    انضم إلى المسابقة
  • تداول بحكمة، اربح جهازا
    قم بتعبئة حسابك بمبلغ لا يقل عن 500 دولار ، واشترك في المسابقة ، واحصل على فرصة للفوز بأجهزة الجوال.
    انضم إلى المسابقة
  • بونص 100٪
    فرصتك الفريدة للحصول على بونص 100٪ على إيداعك
    احصل على بونص
  • بونص 55٪
    تقدم بطلب للحصول على بونص 55٪ على كل إيداع
    احصل على بونص
  • بونص 30٪
    احصل على بونص 30٪ في كل مرة تقوم فيها بتعبئة حسابك
    احصل على بونص

المقالات الموصى بها

لا تستطيع التحدث الآن؟
اطرح سؤالك في الدردشة.
Widget callback