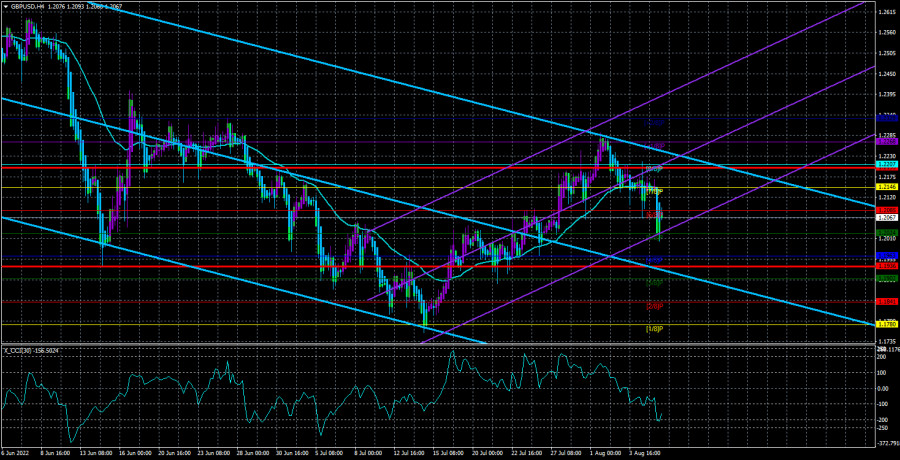
On Friday, GBP/USD extended the downtrend, which resumed after consolidation below the MA. The last days of the previous trading weeks turned out to be busy and eventful as the Bank of England announced its interest rate decision and the US saw the release of important data. Both times, the sterling dropped. Overall, it wasn't a big fall. Nevertheless, no matter how resistant the British currency is to the dollar, a new phase of the global downtrend should begin now. This is due to the fact that nothing has changed for the pair in recent weeks. Yes, it has soared by around 500 pips but solely on a 0.50% rate hike by the Bank of England. Since the market has already priced in the regulator's decision, there is no more reason to buy the pound anymore. In the United States, macro reports are mainly strong (but for GDP). Moreover, geopolitical factors provide additional support for the dollar. That is, all factors are driving the greenback up, not the pound. Moreover, the pair failed to get into the Ichimoku cloud in the 24-hour time frame, which means that the dollar is likely to extend growth.
In other words, GBP/USD could be bearish in the coming weeks, update the 2-year low, and then head towards 30-year lows. The pound is likely to be bearish not just because of the Fed's support for the greenback but also because of Governor Bailey's recent statement saying that the British economy is sliding into a recession, which could last for at least 15 months. Moreover, the regulator sees inflation accelerating to 13% and reaching the target rate as early as in 2 years. So, GBP is unlikely to show growth any time soon.
Fresh data on US inflation may boost the greenback.
As for the UK, it will see the release of important statistics on Friday only. These will be reports on Q2 GDP and industrial production. GDP is expected to come in at -0.2 on a quarterly basis. If the figures come in line with the forecast, it will indicate that the economy is contracting. In such a case, only the European economy will be hovering above zero. However, this is not surprising as the ECB is in no hurry to tighten its monetary policy. If the regulator raised the rate 5-6 times in a row, like the BoE or the Fed, GDP in the eurozone would now also be in the red zone from time to time.
Data on US inflation for July will be of greater importance. Experts see the CPI slowing and coming in at around 8.7 to 9.1% year-on-year. In June, inflation rose to 9.1%. In our view, even if the forecast is accurate, a fall in the reading to 8.7% can't be considered significant because inflation will hardly have had time to react to the second 0.75% rate hike. Therefore, the September report will be of crucial importance. However, should the CPI show an insignificant fall in September, the Fed will have no other choice but to raise the interest rate by 0.75% for the third time. Meanwhile, new rate increases are good for the greenback. Again, in case of a modest drop in the inflation rate, the market may start buying USD in advance, which will indicate that the Fed will definitely announce a rate hike in September.

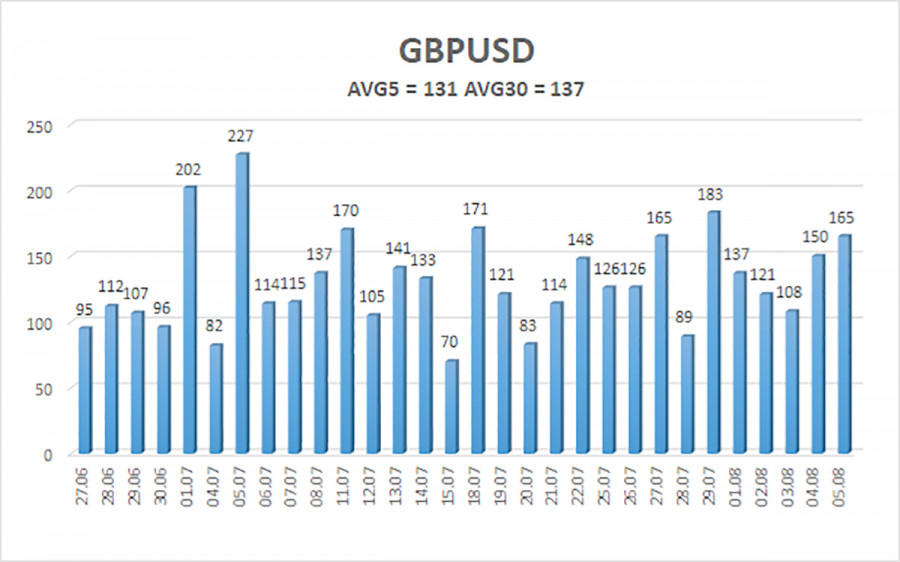
On August 8, the 5-day volatility of GBP/USD totals 131 pips. Today, the pound/dollar pair is expected to move in the range between 1.1936 and 1.2199. Heiken Ashi's upward reversal will signal a new corrective move.
Support:
S1 – 1.2024
S2 – 1.1963
S3 – 1.1902
Resistance:
R1 – 1.2085
R2 – 1.2146
R3 – 1.2207
Outlook:
GBP/USD is below the MA in the H4 time frame. So, short positions could be held with targets at 1.2024 and 1.1963 until Heiken Ashi's upward reversal. New long positions could be considered after consolidation above the MA with targets at 1.2207 and 1.2268.
Indicators on charts:
Linear Regression Channels help identify the current trend. If both channels move in the same direction, a trend is strong.
Moving Average (20-day, smoothed) defines the short-term and current trends.
Murray levels are target levels for trends and corrections.
Volatility levels (red lines) reflect a possible price channel the pair is likely to trade in within the day based on the current volatility indicators.
CCI indicator. When the indicator is in the oversold zone (below 250) or in the overbought area (above 250), it means that a trend reversal is likely to occur soon.


