EUR/USD 5M
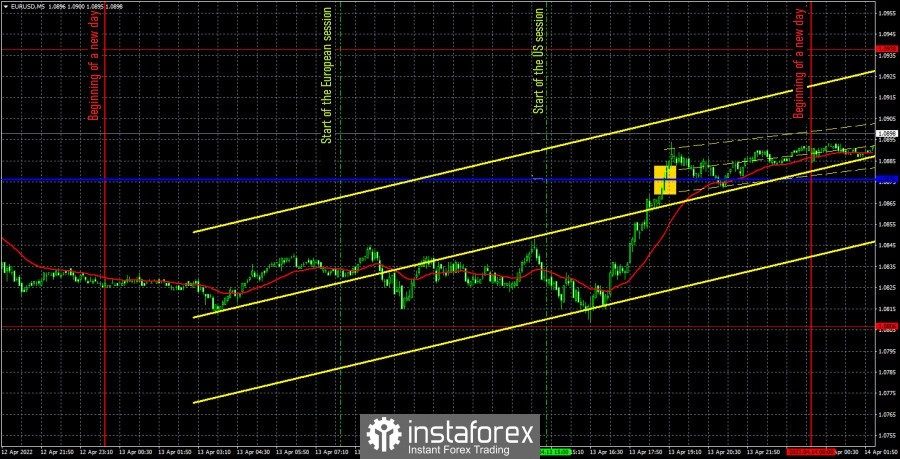
The EUR/USD pair traded in its characteristic manner that has been observed in recent days. That is, sideways and with low volatility. However, a few hours after the start of the US trading session, the dollar began to fall. The fall was impressive and almost out of the blue. What does it mean? At the time when this movement began, no important reports or events were planned. However, there are two hypotheses why what happened to the dollar happened. The first is that the price has come too close to the level of 1.0806, which is a 15-month low. And although there was no rebound from it, the growth could still be triggered by a "pseudo-rebound" from this level. The second is the report on crude oil reserves in the United States, which exceeded the forecast value by nine times. However, even despite such an increase in the euro currency, the downward trend has not been reversed, and the euro may resume to fall at any moment. The global fundamental and geopolitical backgrounds have not changed for the pair, so we are not waiting for trend changes yet.
Unfortunately, only one signal was generated during the day yesterday. It was formed when all the upward movement had already ended. Again, unfortunately, the price could not reach the extreme level of 1.0806 by only three points. Otherwise, a strong buy signal would be formed, which could bring at least 70 points of profit to traders. And as a result, the buy signal was formed only near the critical line. Naturally, this signal should not have been worked out any more. Thus, not a single transaction on the euro currency was opened on Wednesday.
COT report:
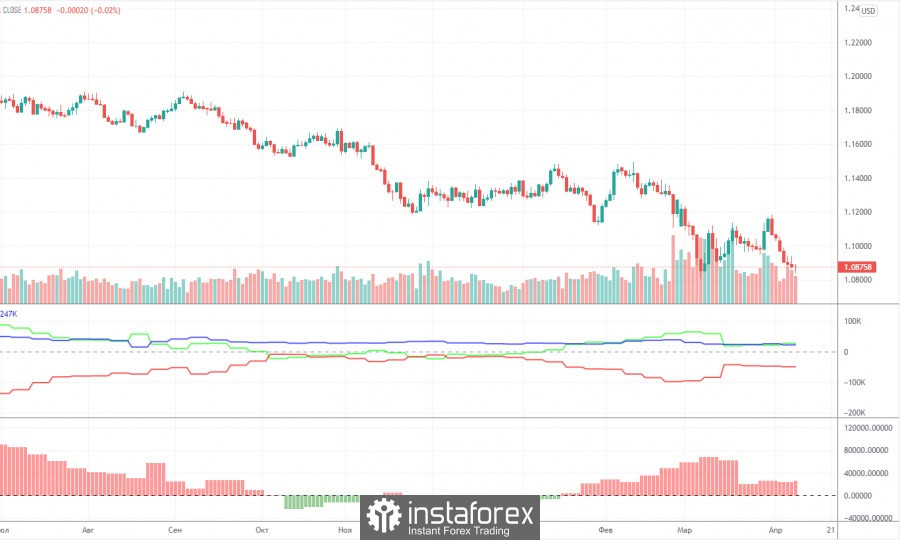
The latest Commitment of Traders (COT) report turned out to be more interesting than the previous ones. Even paradoxical, because the big players were building long positions. During the reporting week, the number of longs increased by 10,800, and the number of shorts in the "non-commercial" group - by 4,800. Thus, the net position increased by 6,000 contracts. This means that the bullish mood has intensified. It is bullish, since the total number of long positions now exceeds the total number of short positions with non-commercial traders by almost 30,000. Accordingly, the paradox lies in the fact that the mood of traders is bullish, but the euro is falling almost non-stop. We have already explained in previous articles that this effect is achieved by an even higher demand for the US dollar. It turns out that the demand for the dollar is higher than the demand for the euro, which is why the dollar is rising against the euro currency. Based on this conclusion, these COT reports on the euro currency now do not make it possible to predict the pair's further movement. They are, one might say, meaningless. However, if the demand for the euro starts to fall among professional players, this may lead to an even greater fall in the euro, since the demand for the dollar is likely to remain high due to geopolitics and macroeconomics.
We recommend to familiarize yourself with:
Overview of the EUR/USD pair. April 14. The euro is at death's door. There is almost no chance of recovery.
Overview of the GBP/USD pair. April 14. Inflation in Britain is rising, the Bank of England wants to raise rates, but will the economy allow it?
Forecast and trading signals for GBP/USD on April 14. Detailed analysis of the movement of the pair and trading transactions.
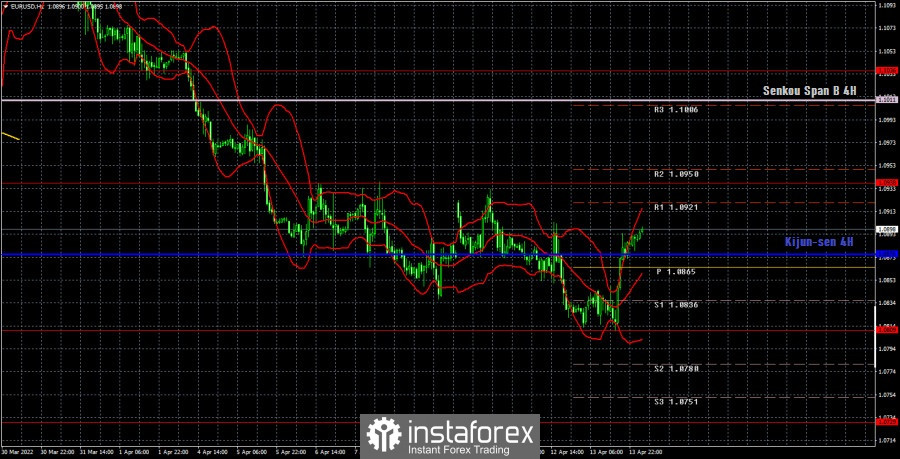
EUR/USD 1H

It is clearly visible on the hourly timeframe that the pair has started a new round of correction against the downward trend. At the moment, the price is not far from the critical line, so now it is not even possible to say that this line has been overcome. This means that a rebound or a "false breakout" may occur from it. One way or another, but the euro has not even managed to reach its previous local high yet. Therefore, despite the rather strange growth on Wednesday, we believe that the probability of a fall in the euro remains very high. We allocate the following levels for trading on Thursday – 1.0729, 1.0809, 1.0938, 1.1036, as well as the Senkou Span B (1.1011) and Kijun-sen (1.0876) lines. The lines of the Ichimoku indicator can move during the day, which should be taken into account when determining trading signals. There are also support and resistance levels, but no signals will be formed near them. Signals can be "bounces" and "breakthrough" levels - extremes and lines. Do not forget about placing a Stop Loss order at breakeven if the price went in the right direction of 15 points. This will protect you against possible losses if the signal turns out to be false. The European Union will summarize the results of an absolutely meaningless European Central Bank meeting on April 14. "Meaningless" - because no one is waiting for any important decisions on monetary policy from the central bank now. And no one expects loud statements from ECB President Christine Lagarde now. Thus, the market reaction may follow, but there is little chance of this. We take note of the report on retail sales in America.
Explanations for the chart:
Support and Resistance Levels are the levels that serve as targets when buying or selling the pair. You can place Take Profit near these levels.
Kijun-sen and Senkou Span B lines are lines of the Ichimoku indicator transferred to the hourly timeframe from the 4-hour one.
Support and resistance areas are areas from which the price has repeatedly rebounded off.
Yellow lines are trend lines, trend channels and any other technical patterns.
Indicator 1 on the COT charts is the size of the net position of each category of traders.
Indicator 2 on the COT charts is the size of the net position for the non-commercial group.