Details of the economic calendar from February 18:
Retail sales in the UK managed to surprise investors with their stunning growth, but this did not affect the financial market. So, a decline of 1.7% was replaced by an increase of 9.1%, which looks fantastic. The pound sterling showed interest in growth, but it was already overbought and was moving around an important level. As a result, positive data on Britain did not affect the market in any way.
During the American trading session, data on sales in the secondary housing market in the United States were published, where they expect a decline of 1% in January, but instead saw an increase of 6.7%. The data turned out to be better than expected, the US dollar received local support from buyers.
Analysis of trading charts from February 18
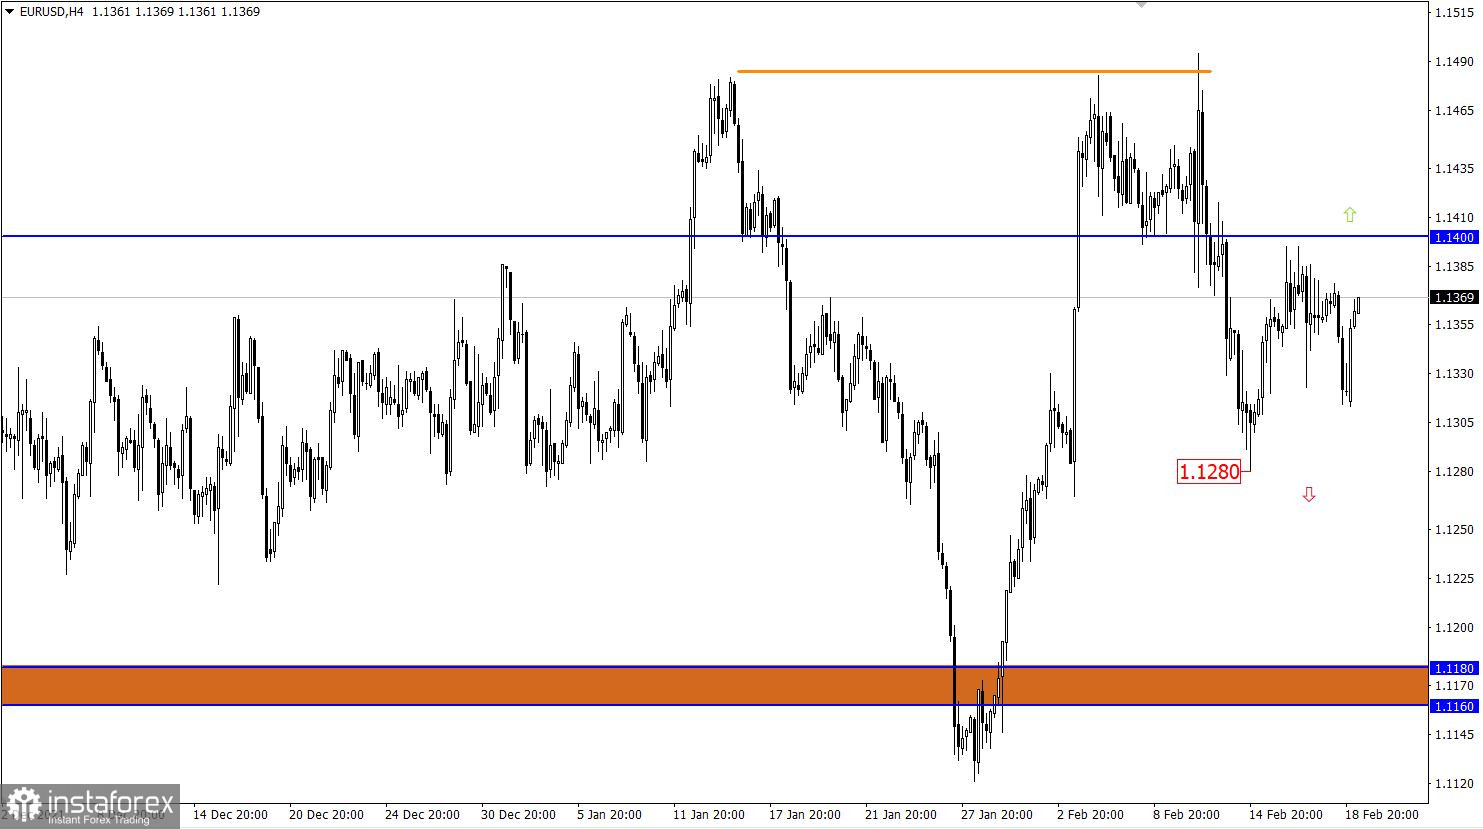
The EURUSD currency pair is moving below the resistance level of 1.1400, which indicates the prevailing interest of traders in short positions. At the same time, it is worth paying attention to a number of Doji type candles, during the period of January 16 and 17, their accumulation confirms the level of resistance in the market.
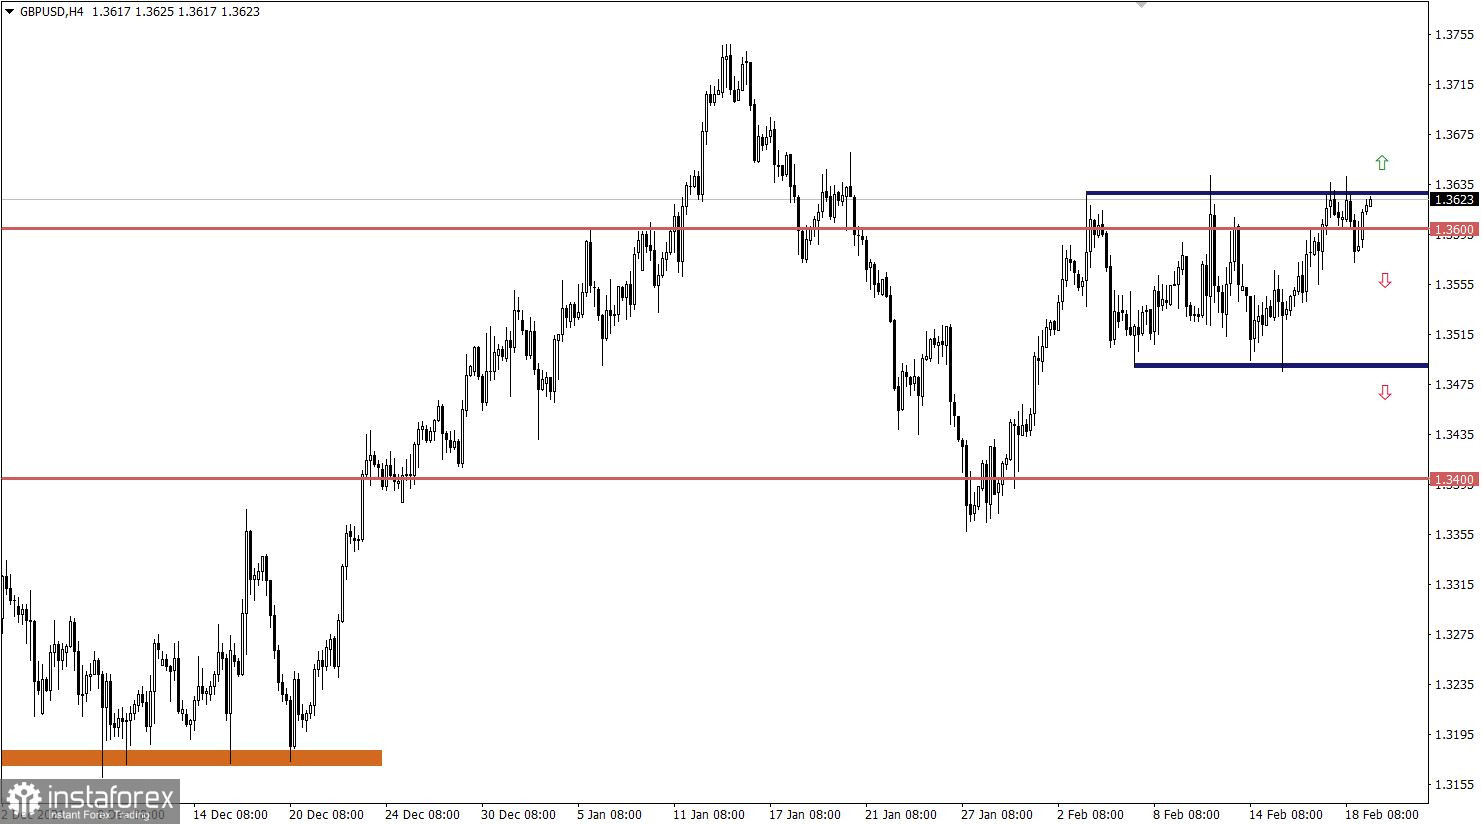
Despite the local activity, the British currency is still moving within the sideways channel deviation. This signals that traders are not yet ready for cardinal changes in the market. The values of 1.3480 and 1.3630 serve as signal levels. Holding the price behind one of the levels in a four-hour period would be a signal of the end of the flat. Until then, the side channel remains in the market.
February 21 economic calendar:
Today, a preliminary assessment of business activity indices in Europe and the UK is expected to be published, where all indicators are expected to grow. This is certainly a positive factor, which can play on the value of the euro and the pound against the dollar. However, the market dynamics will be reduced due to the weekend in the United States, which will negatively affect trading volumes.
Time targeting
EU Manufacturing PMI (Feb.) - 12:00 UTC
EU Services PMI (Feb.) - 09:00 UTC
UK Manufacturing PMI (Feb.) - 12:30 UTC
UK Services PMI - 09:30 UTC
USA - President's Day
Trading plan for EUR/USD on February 21:
In this situation, sell positions will be most in demand as long as the quote is below the level of 1.1400. It is worth considering that a new round of growth in the volume of short positions is expected after holding the price below the local low on February 14 - 1.1280. As for the upward scenario, local price jumps are possible here, following the example of the start of the Asian session of the current day. The main increase in the volume of long positions can occur only after holding the quote above 1.1400 for at least a four-hour period.
Trading plan for GBP/USD on February 21:
In this situation, the market participants pay special attention to price fluctuations within the area of the upper border of the flat. A stable hold of the price above 1.3630 in a four-hour period may lead to a breakdown of the side channel along an upward trajectory. This step will lead to the price movement to the local maximum of January. At the same time, holding the price below the value of 1.3570 in a four-hour period may restart the oscillation cycle within the 1.3500/1.3600 range.
What is reflected in the trading charts?
A candlestick chart view is graphical rectangles of white and black light, with sticks on top and bottom. When analyzing each candle in detail, you will see its characteristics of a relative period: the opening price, closing price, and maximum and minimum prices.
Horizontal levels are price coordinates, relative to which a stop or a price reversal may occur. These levels are called support and resistance in the market.
Circles and rectangles are highlighted examples where the price of the story unfolded. This color selection indicates horizontal lines that may put pressure on the quote in the future.
The up/down arrows are the reference points of the possible price direction in the future.