EUR/USD 5M
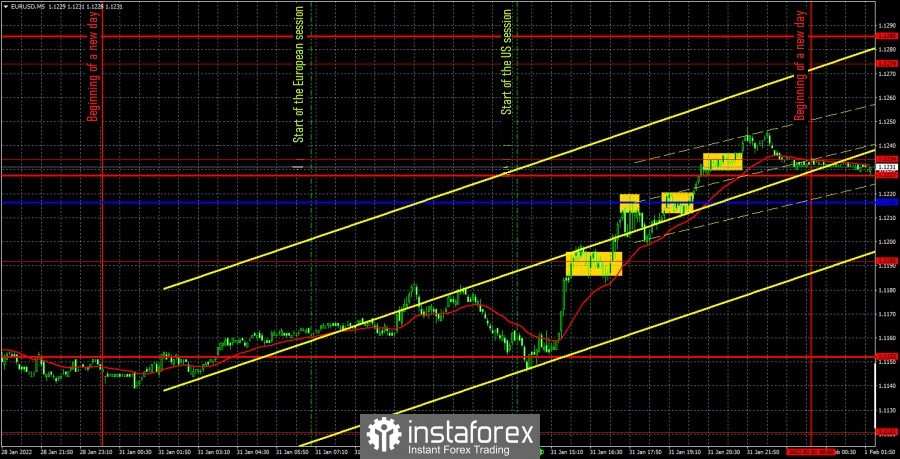
The EUR/USD pair was trading with an upward bias during the first trading day of the week, which was absolutely predictable. The price needed to adjust after a strong fall last week. Therefore, the euro's growth was purely technical. And, most likely, it would have been much stronger if not for the report on GDP in the European Union, which turned out to be simply disappointing. It was after its release that the European currency fell by 30 points. If it were not for this report, then, most likely, the pair would only move up all day. Therefore, in general, the movements on Monday were not the most successful. However, there is also good news. During the day, only one signal was formed – to buy, when the price overcame the extreme level of 1.1192. After that, the pair managed to go up about 18 points and stopped near the critical Kijun-sen line. Therefore, it was possible to earn around 20 points yesterday. A long position could not have been a losing one, since the price went up more than 15 points in total, so a Stop Loss order should have been placed at breakeven. After this transaction, several more signals were formed, as the upward movement continued and was very strong, for a day with a single macroeconomic report. But all of them were formed too late in time. In general, at the beginning of the new week, the pair may continue to adjust ahead of the European Central Bank meeting on Wednesday and the Nonfarm report in the US on Friday.
COT report
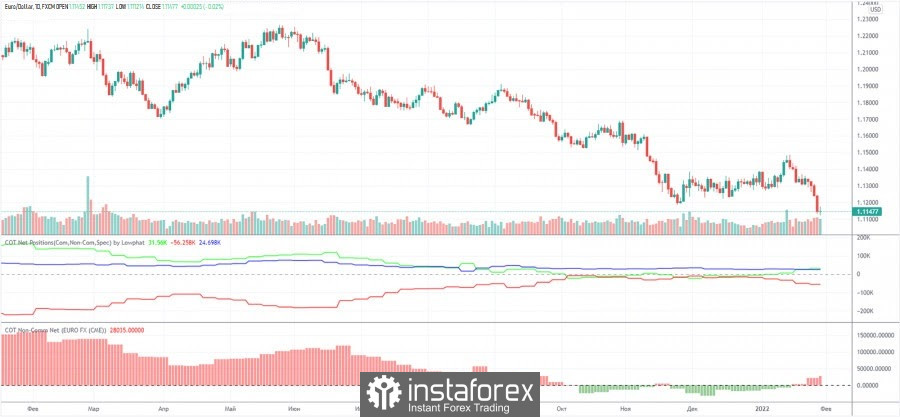
The new Commitment of Traders (COT) report, which was released, turned out to be very interesting. First of all, from the point of view that the European currency, even without really adjusting, began a new decline, but at the same time, recent COT reports indicate that non-commercial traders have increased buy contracts (long positions), which are the most important category. Recently, their net position has grown, and the mood has become bullish again. "Moderately bullish." However, over the past two weeks, the euro currency has fallen by 350 points, which clearly does not correspond to the mood of professional players. However, this data should not be misleading. First of all, the last decline by 150 points after the Federal Reserve meeting happened at the end of the week, so these days were not included in the latest COT report (it comes out three days late). Secondly, if we cut off the last round of the fall of the euro currency, it turns out that there has not been any strong decline yet. That is, the mood of traders may change in the direction of bearish in the next COT report, or it will not change, but then the euro will stop getting cheaper. The green and red lines of the first indicator (the net positions of the "non-commercial" and "commercial" groups) are currently moving away from each other, which indicates the beginning of a new trend. The growth of the green line indicates the beginning of a new upward trend. Therefore, we need to wait for the next COT report so that we can make a more accurate conclusion.
We recommend to familiarize yourself with:
Overview of the EUR/USD pair. February 1. The European economy: failure, failure and failure again.
Overview of the GBP/USD pair. February 1. Boris Johnson will use the tensions in Eastern Europe to his advantage.
Forecast and trading signals for GBP/USD on February 1. Detailed analysis of the movement of the pair and trading transactions.
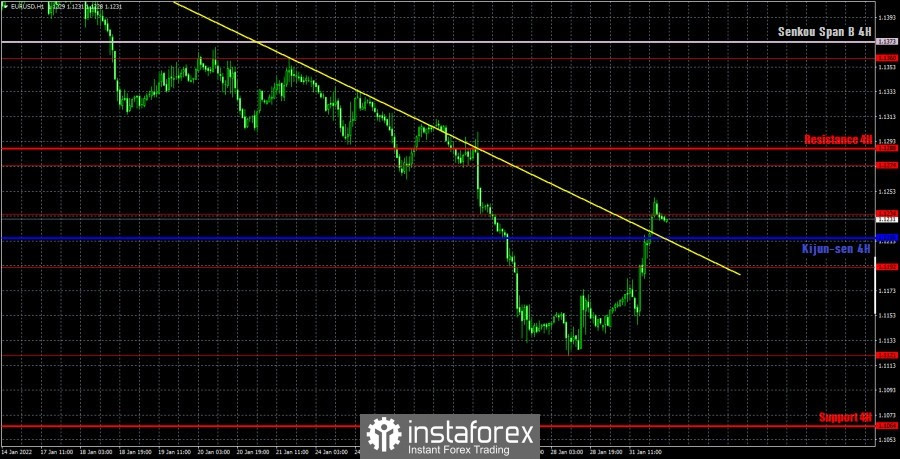
EUR/USD 1H

The technical picture on the hourly timeframe has changed quite a lot on Monday. In particular, the price has settled above the downward trend line, so now we can expect the European currency to continue to grow. From a fundamental point of view, it is not justified, but traders have found reasons to buy euros on Monday! We allocate the following levels for trading on Tuesday - 1.1121, 1.1192, 1.1234, 1.1274, as well as the Senkou Span B (1.1373) and Kijun-sen (1.1216) lines. The lines of the Ichimoku indicator may change their position during the day, which should be taken into account when searching for trading signals. Signals can be "bounces" and "breakthroughs" of these levels and lines. Do not forget about placing a Stop Loss order at breakeven if the price went in the right direction of 15 points. This will protect you against possible losses if the signal turns out to be false. The European Union will publish the index of business activity in the field of production (not the most important indicator), as well as the unemployment rate on February 1. Both of these reports are highly likely to be ignored. But the ISM manufacturing business activity index in the United States should be worked out, unless, of course, its value does not completely coincide with the forecast. At the same time, the pair can continue to move with good volatility, as on Monday (more than 80 points were passed).
Explanations for the chart:
Support and Resistance Levels are the levels that serve as targets when buying or selling the pair. You can place Take Profit near these levels.
Kijun-sen and Senkou Span B lines are lines of the Ichimoku indicator transferred to the hourly timeframe from the 4-hour one.
Support and resistance areas are areas from which the price has repeatedly rebounded off.
Yellow lines are trend lines, trend channels and any other technical patterns.
Indicator 1 on the COT charts is the size of the net position of each category of traders.
Indicator 2 on the COT charts is the size of the net position for the non-commercial group.