EUR/USD 5M
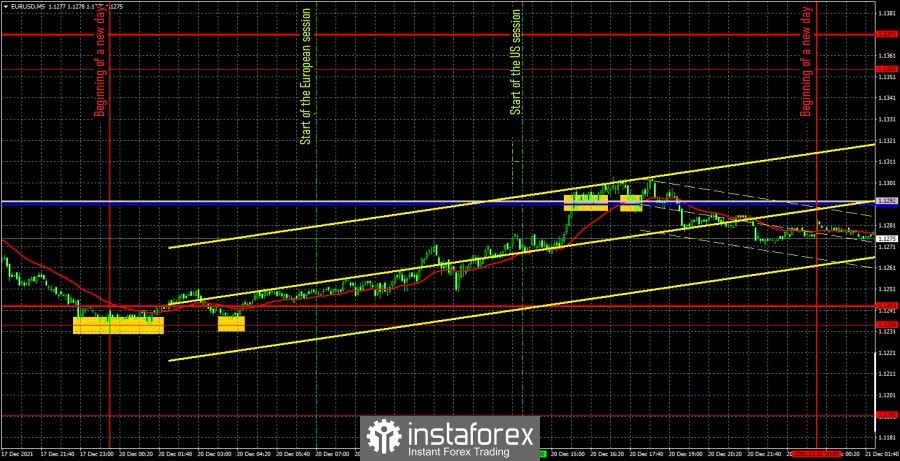
The EUR/USD pair showed a movement that was most logical when examining the technical picture in detail. In previous articles we have already said that the pair is now in the 1.1234-1.1355 horizontal channel. This is not seen so well on the 5-minute TF, but is excellent on the higher TFs. Thus, after the quotes of the pair bounced off the level of 1.1234, which is the lower border of this channel, an upward movement began to the upper border of the channel at night. During the day, the euro/dollar pair still could not reach this line, but on the other hand, moving 80 points up out of the blue on a completely empty Monday would have been too much. Not a single macroeconomic report was published on Monday, not a single fundamental event took place. Therefore, we just have to deal with the technical signals. There was a very delicate situation here, since two signals were formed at night. And we do not recommend trading at night, we just think that most traders are sleeping at this time and cannot follow the market. However, the signals were strong and accurate, and at the time of the opening of the European trading session, the price moved away from the points of formation of these signals by only 5-6 points. Therefore, it was possible to open long positions at the very beginning of the European session. This was the right decision, since later the price reached the Kijun-sen and Senkou Span B lines, and also crossed them. It was possible to manually close long positions in the late afternoon. The profit was about 47 points. As for Monday and the empty calendar, the pair's volatility was very good.
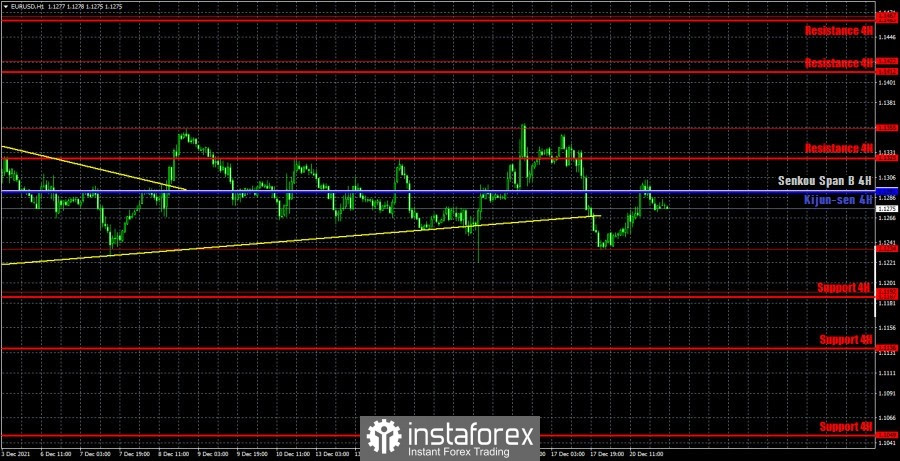
EUR/USD 1H

You can clearly see on the hourly timeframe that the pair has spent the last weeks exclusively between the levels of 1.1234 and 1.1355. Thus, it is just right to talk about flat. At this time, the price is moving to the upper border of this channel, and in general, in the next two weeks, it can calmly continue to be within it. Despite the fact that the holiday weeks have begun, the pair's volatility remains quite good. Remember what happened a couple of months ago, when 3-4 days out of every 5 ended in 40 points volatility! Now you can trade every day. We highlight the following levels for trading on Tuesday - 1.1192, 1.1234, 1.1355, as well as the Senkou Span B (1.1291) and Kijun-sen (1.1291) lines. The Ichimoku indicator lines can change their position during the day, which should be taken into account when looking for trading signals. Signals can be "rebounds" and "breakthroughs" of these levels and lines. Do not forget about placing a Stop Loss order at breakeven if the price moves 15 points in the right direction. This will protect you against possible losses if the signal turns out to be false. We also take into account that the pair is now flat, so the Ichimoku indicator lines are weaker than usual. The European Union and the United States will not have a single interesting event or a single macroeconomic report on December 21. Thus, traders will have to trade on a pure "technique" today. Fortunately, volatility allows you to do this.
We recommend you to familiarize yourself:
Overview of the EUR/USD pair. December 21. The European Central Bank did not provide any support for the euro currency.
Overview of the GBP/USD pair. December 21. The epidemiological situation in the United Kingdom and the United States is deteriorating.
Forecast and trading signals for GBP/USD for December 21. Detailed analysis of the movement of the pair and trade deals.
Analysis of the COT report

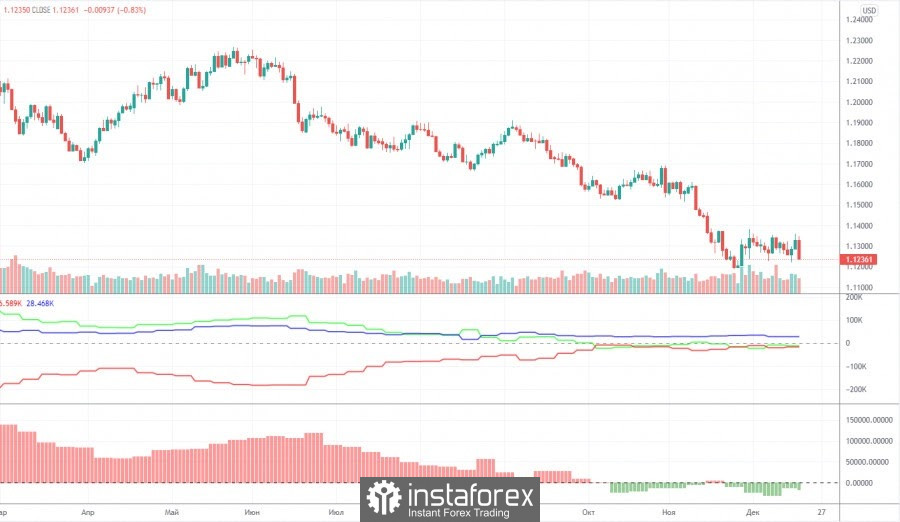
The mood of non-commercial traders has become... a little more bearish during the last reporting week (December 7-13). The "non-commercial" group of traders now has more short positions than long ones, but this advantage is minimal. The difference is only 18,000 contracts, which is not so much. During the reporting week, professional traders closed 7,200 buy contracts (longs) and 2,800 sell contracts (shorts). Thus, the net position of professional players decreased by 4,000. However, the main thing to note is that the green and red lines of the first indicator (indicating the change in the net positions of the non-commercial and commercial groups) have been near the zero level for a long time, as well as in close proximity to each other. That is, in the last few months, when the European currency continued to fall against the dollar, the major players no longer increased their shorts. Thus, the question arises, why did the euro fall at all if market participants did not sell it? Perhaps global factors, such as changes in the balance between the EU and US money supply, are interfering in the exchange rate formation process again. But according to the Commitment of Traders (COT) reports, we can only conclude that the bearish mood is minimal and has not intensified in recent months. Nevertheless, taking into account the fundamental background, the euro may continue to fall. And the technical picture does not yet give any reason to assume the completion of the fall of the euro currency. The mood of the major players remains bearish, but at the same time the bulls do not seek to change anything.
Explanations for the chart:
Support and Resistance Levels are the levels that serve as targets when buying or selling the pair. You can place Take Profit near these levels.
Kijun-sen and Senkou Span B lines are lines of the Ichimoku indicator transferred to the hourly timeframe from the 4-hour one.
Support and resistance areas are areas from which the price has repeatedly rebounded off.
Yellow lines are trend lines, trend channels and any other technical patterns.
Indicator 1 on the COT charts is the size of the net position of each category of traders.
Indicator 2 on the COT charts is the size of the net position for the non-commercial group.