Here are the details of the economic calendar for December 16, 2021
The Bank of England raised the key rate by 15 bps from 0.10% to 0.25% for the first time in three and a half years. The market did not expect such an event, so traders were confused for a moment. The pound's price eventually surged by 0.75%, but then slowed down.
Such an extraordinary decision was made amid rising consumer prices in Britain. According to the results of November, annual inflation in the country amounted to 5.1%, which is the maximum value since September 2011.
The second most important event is considered to be the ECB meeting, but everything happened without drastic changes there.
Here's the list of ECB's main messages:
- As expected, the ECB kept the base rate at zero and the rate on deposits at -0.5%
- It will increase the monthly pace to 40 billion euros from 20 billion euros in the second quarter
- It will complete the implementation of its COVID-19 emergency program in March 2022
- It will extend its PEPP reinvestments until at least the end of 2024
- Lagarde said that inflation in the Eurozone will remain high temporarily
- ECB raised its forecast for eurozone GDP growth in 2021 from 5% to 5.1%
- ECB expects eurozone's GDP growth in 2024 by 1.6%
- ECB Chairman announced that slowdown in economic growth may be observed in early 2022
- President of the ECB said that inflation will remain above 2% for most of 2022
- The ECB lowered its forecast for GDP growth in the eurozone in 2022 to 4.2% from 4.6%, raised its forecast for GDP growth in 2023 to 2.9% from 2.1%
The European currency moved after the pound sterling due to the positive correlation.
Analysis of trading charts from December 16:
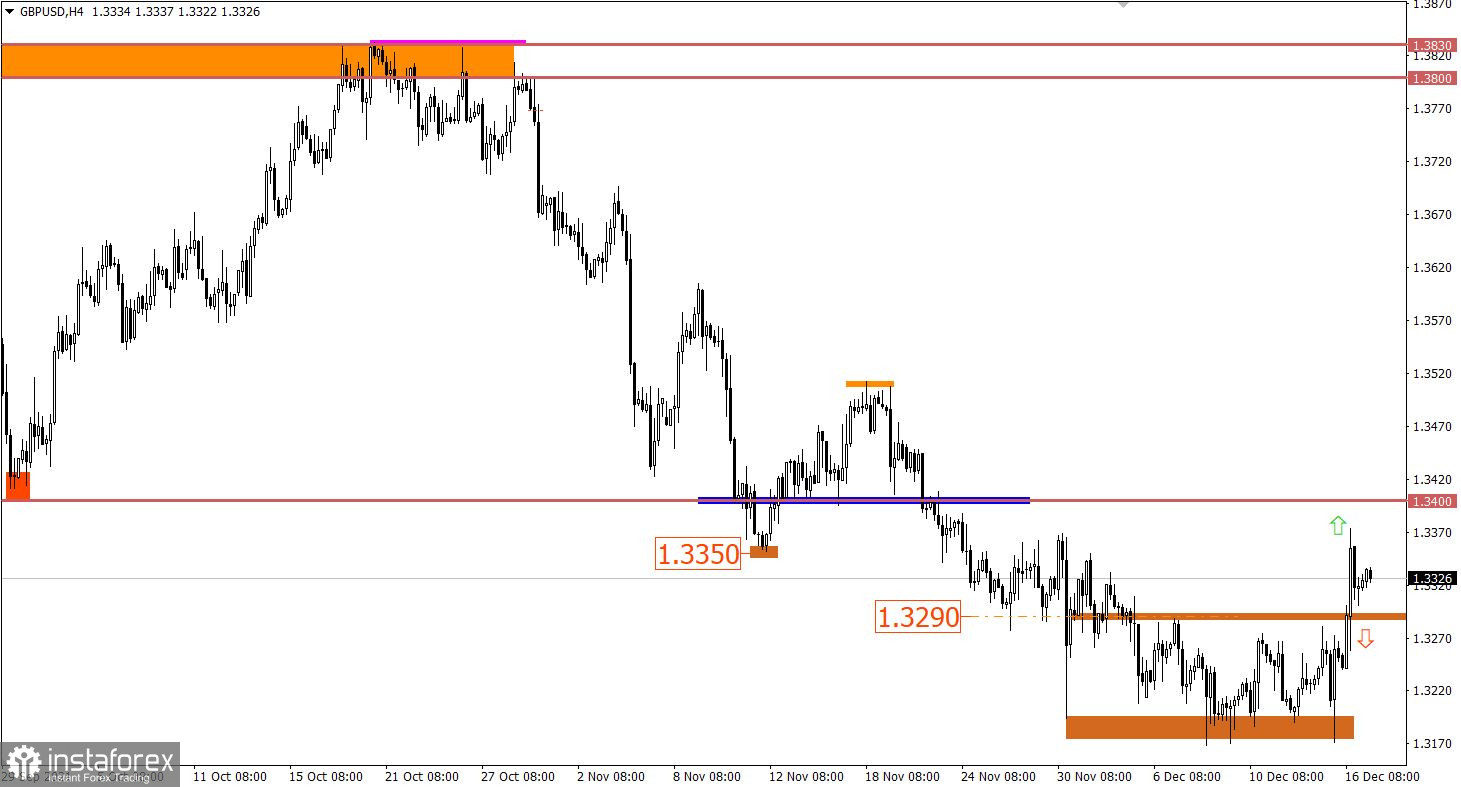
The GBP/USD pair shows to the market the full power of speculation due to the unexpected decision of the Bank of England. As a result, the quotes locally increased by more than 65 points in just 1 minute. After that, the excitement subsided and the upward momentum was replaced by stagnation followed by a pullback.
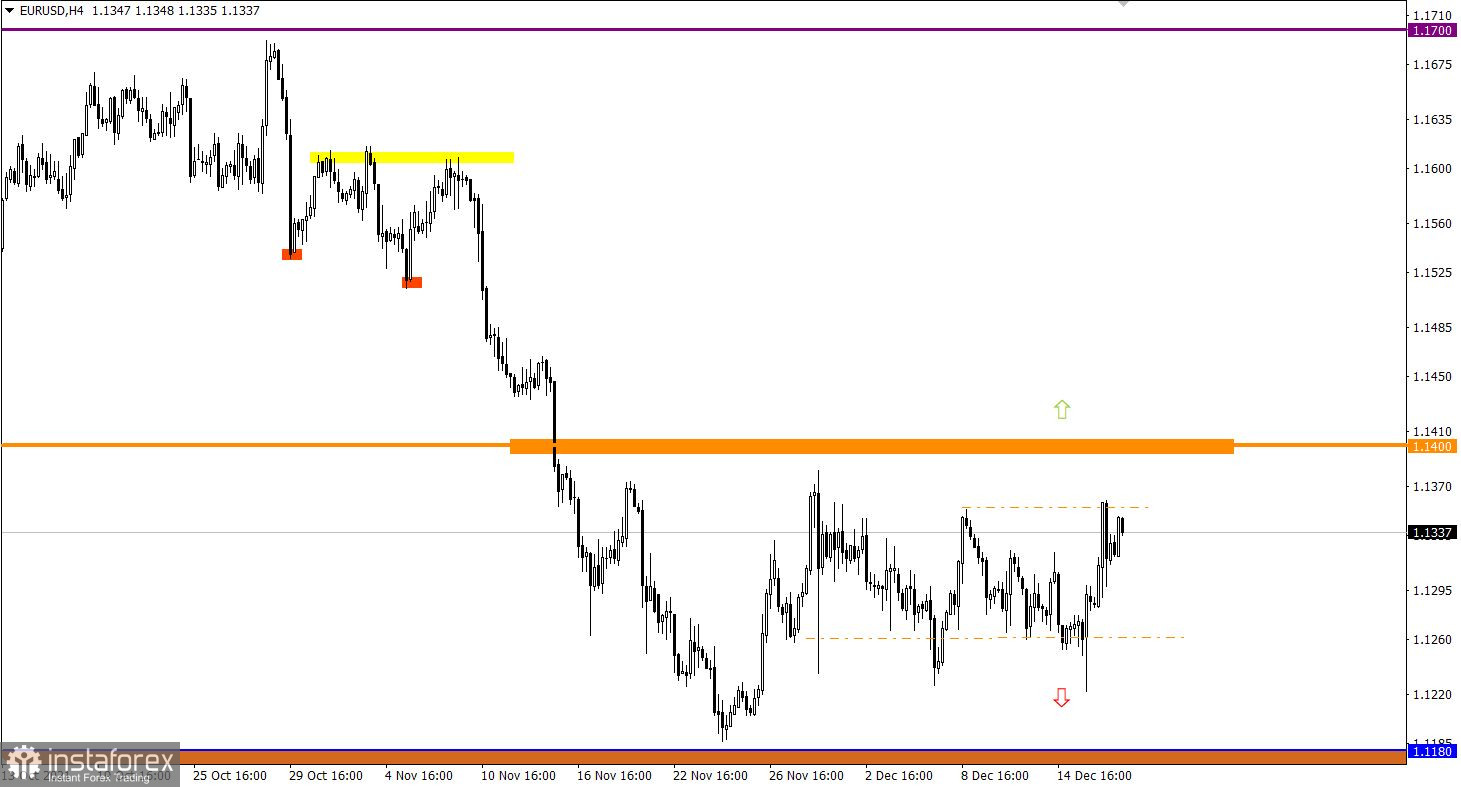
Speculation in the EUR/USD pair this time was reflected from the British currency, where the euro rushed up through a positive correlation. This led to a convergence of the price with the upper limit of the current flat 1.1260/1.1355.
December 17 economic calendar:
The UK's retail sales data was published today at 7:00 Universal time. Its decline was replaced by an increase from -1.3% to 4.7%. The growth in consumer activity will certainly support the pound sterling in the future.
The key event is the publication of inflation data in the eurozone, which may grow from 4.1% to 4.9%.
Against the background of the ECB's complete inaction, consumer price growth is not the best factor, and due to its scale, the euro may well be under pressure from speculators.
Time targeting:
EU Inflation - 13:00 GMT
Trading plan for GBP/USD on December 16:
There is still a large number of speculators on the market despite the stagnation, so new price increases cannot be excluded. In this case, traders will consider buying positions above the level of 1.3375, which will probably lead to a breakdown of the 1.3400 level. In turn, selling positions will be relevant again when the price is held below the level of 1.3290 in a four-hour period.
Trading plan for EUR/USD on December 17:
In this situation, trading on the breakdown of the set boundaries of the flat is no longer sufficient due to the high hype for speculative operations.
There are two strategies considered by traders:
The first strategy is the possible downward impulse that will point to the next direction. Buy positions will become relevant after holding the price above the level of 1.1400 in a four-hour period, while sell positions will be considered after holding the price below the level of 1.1230.
The second one considers a short-term approach, where trading is carried out within a range according to the method of rebounding from the set borders.
What is reflected in the trading charts?
A candlestick chart view is graphical rectangles of white and black light, with sticks on top and bottom. When analyzing each candle in detail, you will see its characteristics of a relative period: the opening price, closing price, and maximum and minimum prices.
Horizontal levels are price coordinates, relative to which a stop or a price reversal may occur. These levels are called support and resistance in the market.
Circles and rectangles are highlighted examples where the price of the story unfolded. This color selection indicates horizontal lines that may put pressure on the quote in the future.
The up/down arrows are the reference points of the possible price direction in the future.